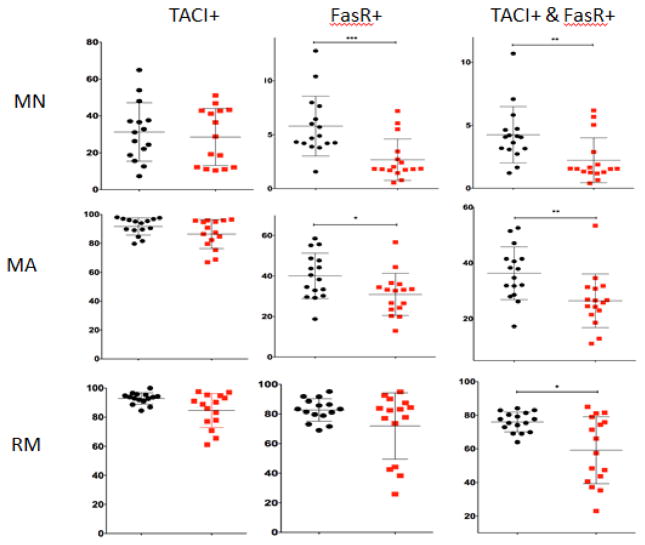
Figure 2. B cell subsets for TACI and FasR.
Shown are the percentages of TACI+, FasR+, or doubly positive TACI+ and FasR+ cells in the MN, MA and RM B cell subsets for control and T1D subjects. Please see Figure 1a for B cell subset scheme and definitions of MA, MN and RM based on CD38 vs. CD27 staining. Three asterisks (***) indicate a p-value that is < 0.001; (**) indicate a p-value that is <0.01 and (*) a p-value that is <0.05. T1D = type 1 diabetes. MN = mature naïve. MA = mature activated. RM = resting memory. TACI = CD267. FasR = CD95.

