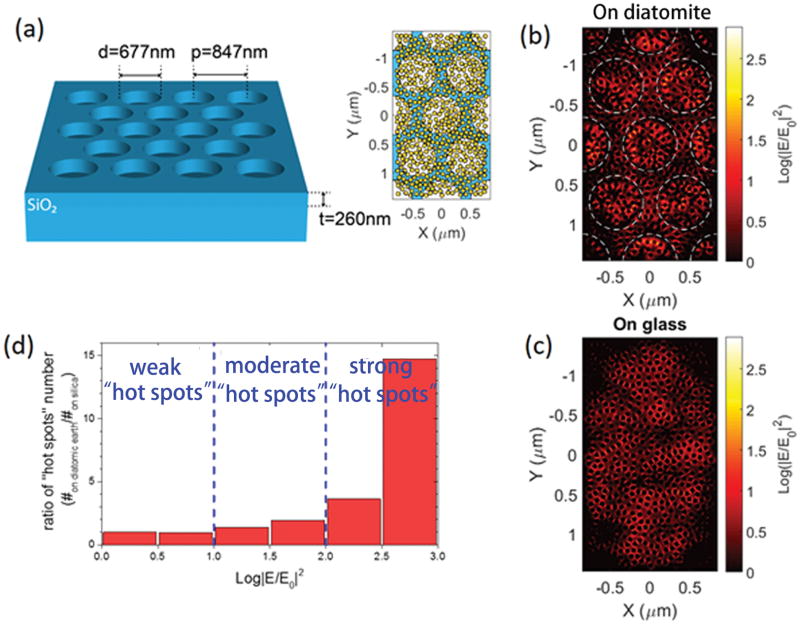
Figure 6.
(a) Schematic of the simulation model for diatomite substrate. Inset: randomly distributed Au NPs on diatomite. The white background represents the place where the Au NPs are placed in the air holes on the bottom silica substrate, and the blue background means where the Au NPs are placed on the top surface of the silica photonic crystal slab. For the reference silica substrate, all the Au NPs are on the substrate surface. Electric field intensity distribution of the Au NPs layer on a diatomite substrate (b) and on a silica substrate (c). (d) enhancement ratio of the “hot spots” distribution over electric field intensity, which is defined as the ratio of numbers of “hot spots” at each intensity level.

