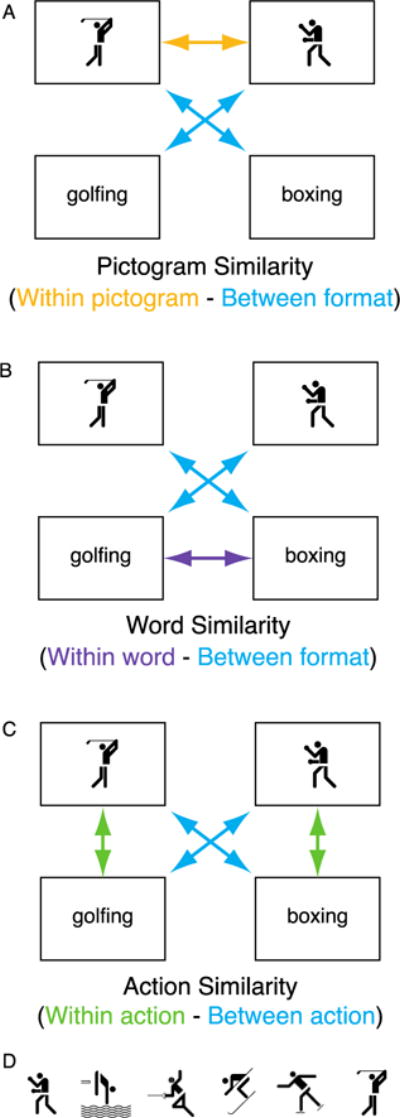
Figure 1.

A) The Pictogram Similarity comparison, showing regions that have higher correlations for pictogram-pictogram pairs compared to cross-format pairs; B) the Word Similarity comparison, showing regions that have higher correlation for word-word pairs compared to cross-format pairs; and C) the Action Similarity comparison, showing regions that have higher correlations for same action cross-format pairs, compared to different action cross-format pairs. Note that only two actions are shown in A–C, but actual analyses included all six action pictograms (shown in D) and their corresponding action verbs. Action pictograms used with permission, © 1976 by ERCO GmbH, www.aicher-pictograms.com.
