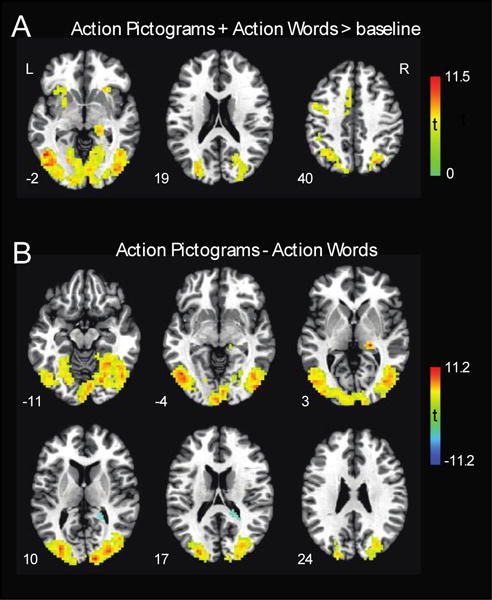
Figure 3.

A) Results from univariate analyses showing regions activated by Action Pictograms (AP) and Action Words (AW) more than baseline. Warm colors indicate regions more active for AP+AW. B) Regions showing differences in presentation format. Warm colors show regions more active in response to AP compared to AW. Cool colors show regions more responsive to AW than AP. All results are significant at p < .001, cluster corrected to α = .01. Results are presented on the Colin brain in standard Talairach space.
