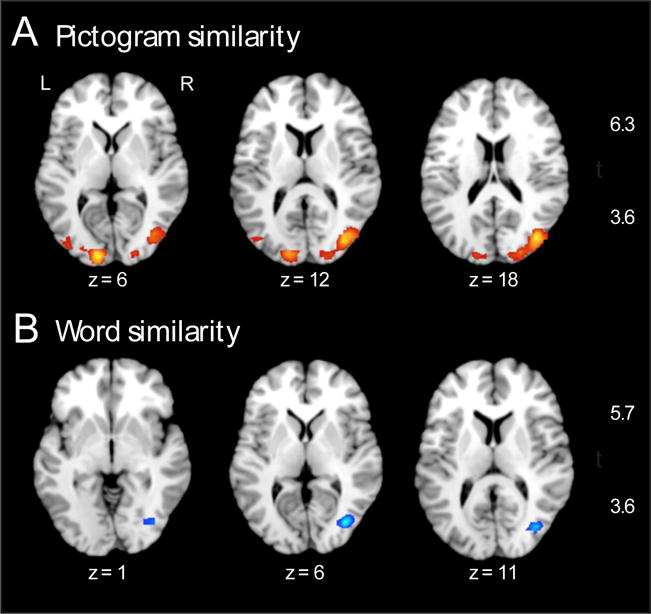
Figure 4.

Results from multivariate analyses of stimulus format. A) Regions showing significantly higher correlations for pictogram-pictogram pairs, compared to cross-format pairs (see Figure 1A for example). B) Regions showing significantly higher correlations for word-word pairs, compared to cross-format pairs (see Figure 1B for example). Both A and B show axial brain slices. Activation is thresholded at p < .001, cluster corrected to α = .01. Results are shown on a standard brain in MNI space in Mango (Research Imaging Institute, University of Texas Health Science Center).
