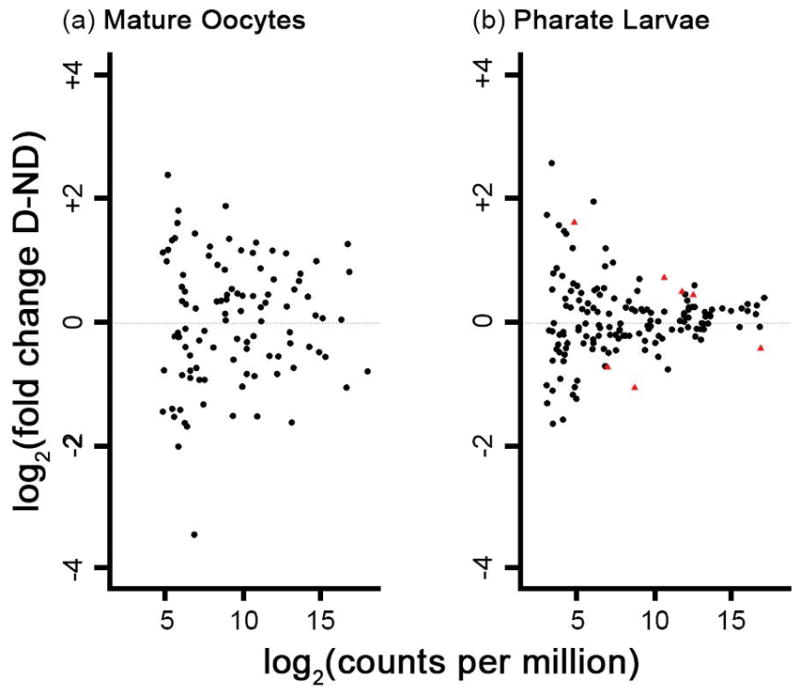
Figure 2.

Log2(fold change) of miRNA abundance under diapause relative to non-diapause conditions versus abundance log2(counts per million) following TMM-normalization for (a) mature oocytes and (b) pharate larvae. Each point represents a single miRNA. MicroRNAs with higher abundance under diapause conditions have positive fold change values. Red triangles indicate significant differences in miRNA abundance between conditions (Fisher’s exact test p<0.05 following Benjamini-Hochberg correction).
