
FIGURE 2.
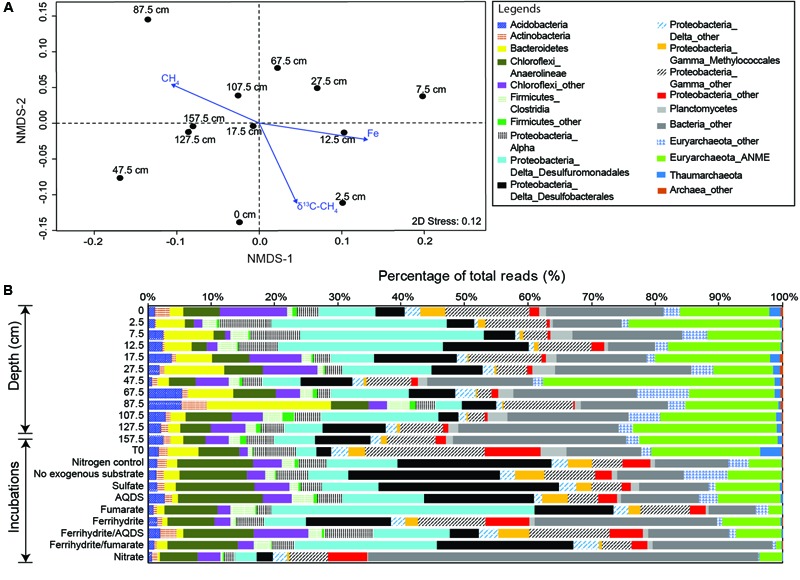
Community compositions and variations revealed by 16S rRNA gene amplicons. (A) Non-metric multidimensional scaling of community relatedness quantified by the weighted Unifrac matrix with the overlay of ordination for selected environmental parameters. (B) Abundances of major divisions for environmental and incubated samples.