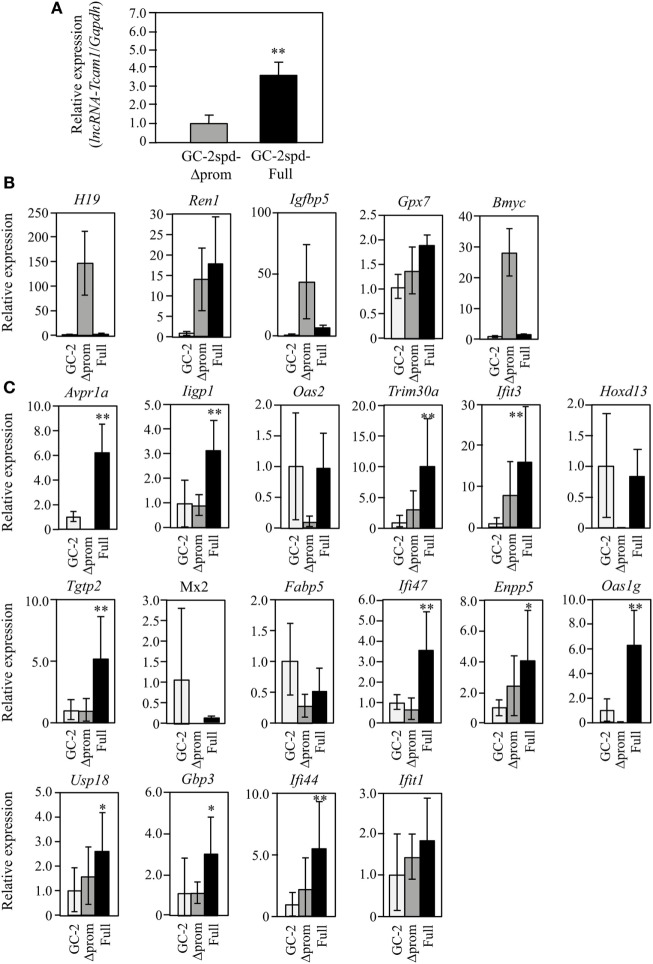
Figure 3.
Expression of lncRNA-testicular cell adhesion molecule 1 (lncRNA-Tcam1) and its target gene candidates in GC-2spd-Full and GC-2spd-Δprom different from those used for RNA-sequencing. (A) lncRNA-Tcam1 expression in GC-2spd-Full and GC-2spd-Δprom. The expression level of lncRNA-Tcam1 was measured by quantitative reverse transcription-polymerase chain reaction (qRT-PCR), and the data were normalized to Gapdh. The level in GC-2spd-Δprom was set to 1.0. The data are the means ± SD from three independent experiments, and the statistical significance was evaluated by Student’s t-test. **P < 0.01 compared to GC-2spd-Δprom. (B) Expression of five candidate genes that were presumed to be suppressed by lncRNA-Tcam1 in GC-2spd(ts) cells without being transfected, GC-2spd-Δprom, and GC-2spd-Full. qRT-PCR was performed, and the data were normalized to Gapdh. The level in GC-2spd(ts) cells was set to 1.0. White bars represent the data from GC-2spd(ts) cells without transfection, and gray and black bars show the values from GC-2spd-Δprom and GC-2spd-Full, respectively. (C) Expression of 16 candidate genes that were presumed to be activated by lncRNA-Tcam1. qRT-PCR was performed, and the data were normalized to Gapdh. The data are presented as in (B). The data for GC-2spd(ts) cells are the averages ± SD from four independent experiments, and the other data represent the means ± SD from three independent experiments. The statistical significance was evaluated by one-way analysis of variance followed by Dunnett’s test in (B,C). *P < 0.05, **P < 0.01 compared to GC-2spd(ts) cells without transfection.

