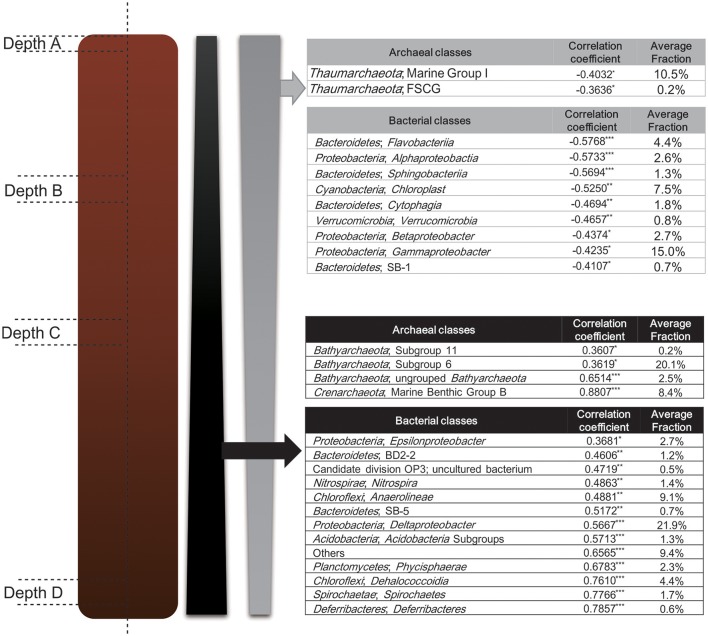
Figure 7.
Pearson correlation analysis between sediment layer depth and abundance of groups at the class level for Bacteria and Archaea. Correlation coefficient with p-value score < 0.05, 0.01, 0.001 is labeled with “*”, “**”, and “***” respectively. Classes are ordered along the increase of correlation coefficient.

