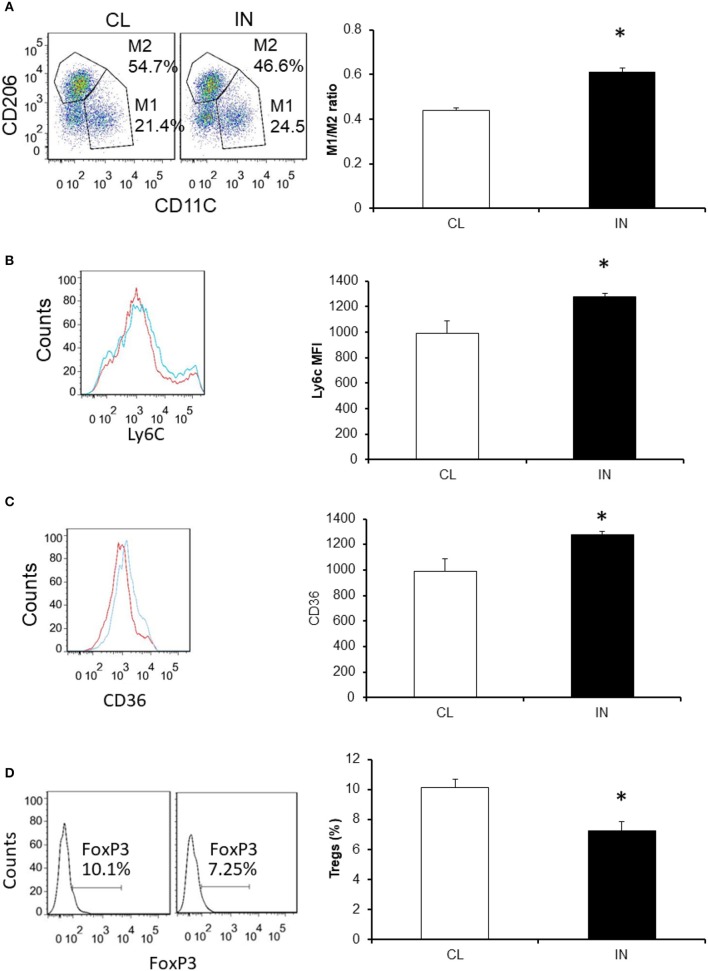
Figure 5.
Effects of IN exposures on vWAT macrophage and Treg populations using flow cytometry. Panel (A) is a representative example for CD11C+ and CD206+ that were used for double positive for macrophages. M1 and M2 macrophages were also identified as CD11c+ or CD206+ cells, respectively. Panel (B) is a representative example for resident macrophages (CD64). Panel (C) is a representative example for M1-like metabolic macrophages (CD36hi ++) in vWAT. Blue color is for SC and red color for IN. Panel (D) is a representative example for Tregs (FoxP3 + and CD4+ cells) in vWAT. Data are shown as means ± SD (n = 8/experimental group). *Indicates statistical significance; p < 0.01.

