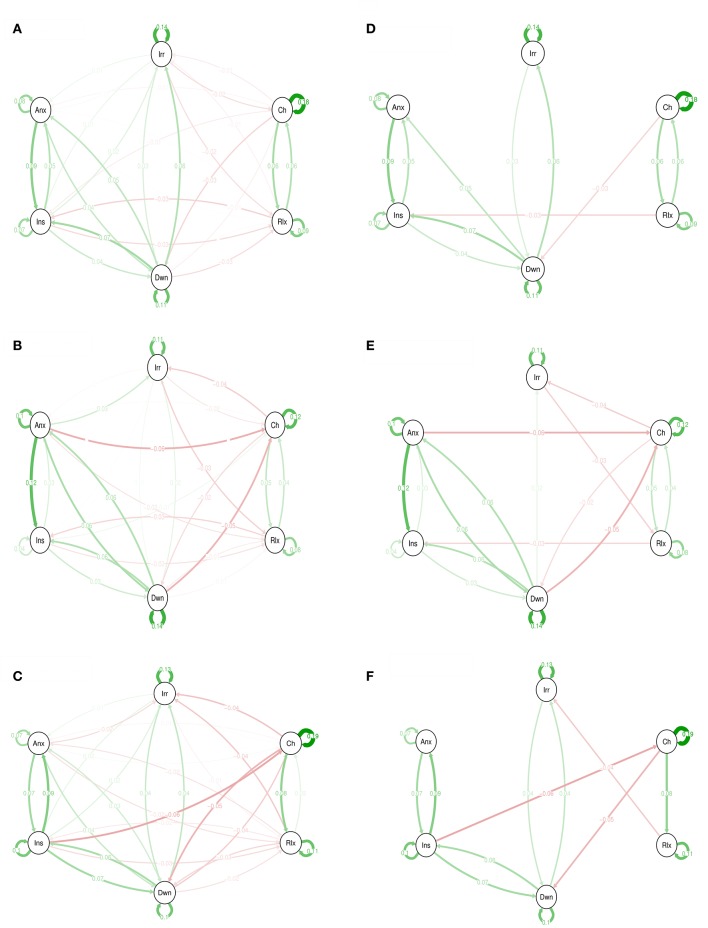
Figure 1.
Emotions networks in subjects with low, medium, and high levels of childhood trauma. In this figure, the arrows represent associations over time; i.e., the B coefficient expressing the effect size of the predictive associations. For example, in the low CT network, there is an arrow from “relaxed” to “cheerful,” meaning that “relaxed” at t−1 predicts “cheerful” at t with a B coefficient of 0.06. Green arrows represent positive associations, and red arrows represent negative associations. The fading of the lines represents the strength of the association and are determined by the regression weights: the more solid the line, the stronger the association (and vice versa). Note that we can predict the emotion item from the previous state of the item itself. These arrows are the self-loops in the network. CT, childhood trauma. Graphs (A–C) are for low, medium, and high CT respectively. The Graphs (D–F) are for low, medium, and high CT respectively but only with associations that resisted to Simes correction for multiple testing with p < 0.022.

