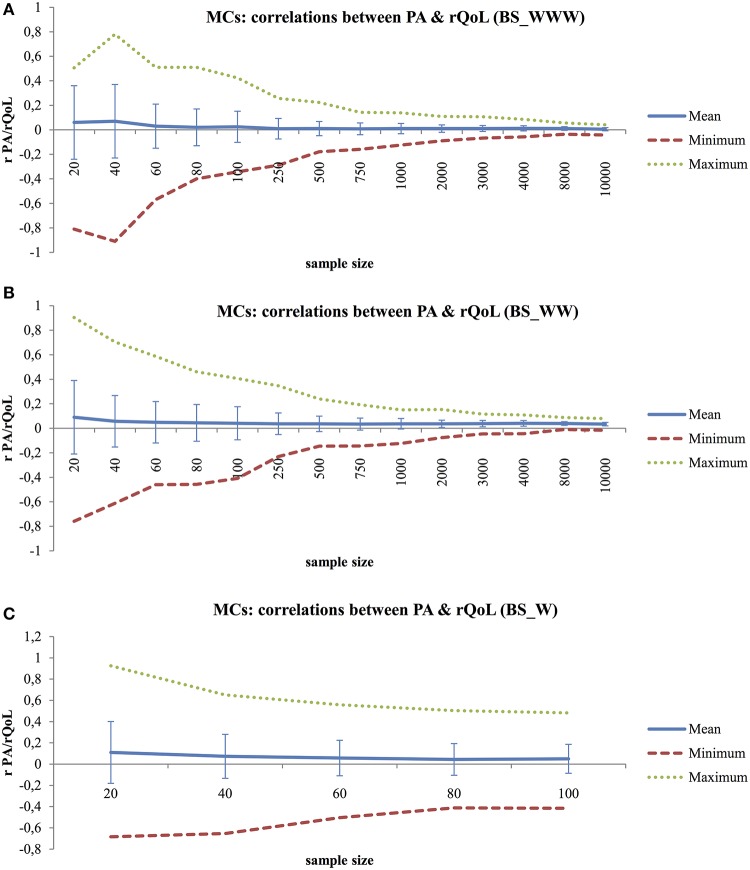
Figure 4.
(A) Monte Carlo Experiment (MCs) to Explore the Relationship between PA Scores and rQoL Scores with Increased Sample Size for Behavior Settings Including Who, What, Where Information (BS_WWW), Using Pearson's Product-Moment Correlations. (B) Monte Carlo Experiment (MCs) to Explore the Relationship between PA Scores and rQoL Scores with Increased Sample Size for Behavior Settings Including Who, What Information (BS_WW), Using Pearson's Product-Moment Correlations. (C) Monte Carlo Experiment (MCs) to Explore the Relationship between PA Scores and rQoL Scores with Increased Sample Size for Behavior Settings Including What Information (BS_W), Using Pearson's Product-Moment Correlations.

