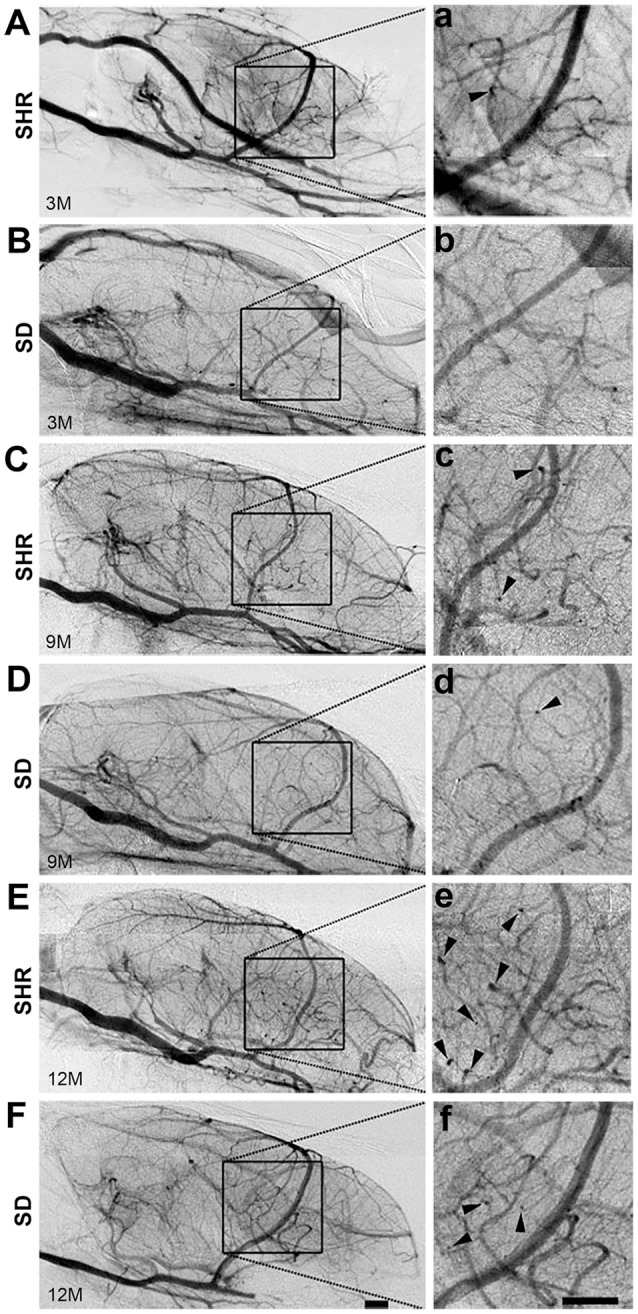
Figure 2.

Curly vessels in the brain of SHR increased significantly than SD rats. Angiography pictures were presented from SHR (A,C,E) and SD (B,D,F) rats in 3-, 9-, and 12-month. The images in square frames of graphs (a–f) were amplified as images (A–F), respectively. Square frame defines the selected area for calculating. Arrowhead points to curly vessels. Scale bar = 1 mm.
