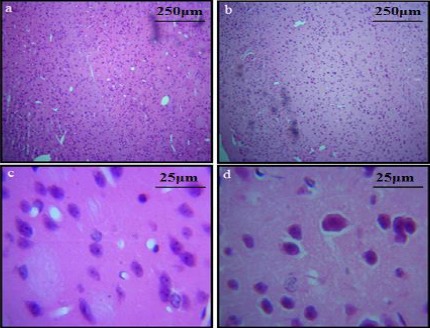
Figure 5.

H&E stained sections of cortex: (a) control group (b) diabetic group (Layers I to VI; original magnification 10X) (c) unaffected neurons of layer 2 of cerebral cortex in control group and (d) diabetic group (original magnification 40X). A decrease in neuronal density can also be observed in cortex of diabetic group
