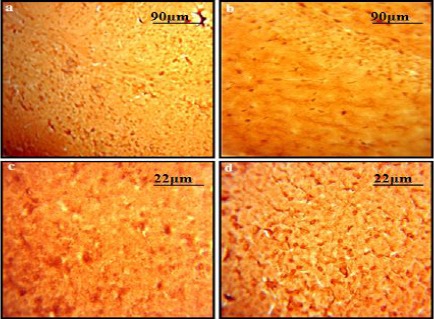
Figure 6.

DAB stained sections representing the status of S-nitrosylated proteins: A comparison of (a) control group and (b) diabetic Group indicates an increase in the amount of S-nitrosylated proteins in response to hyperglycemia in hippocampal region of brain. Original magnification 10X. Similar results were obtained for cortical regions of (c) control group and (d) diabetic group. Original Magnification 40X
