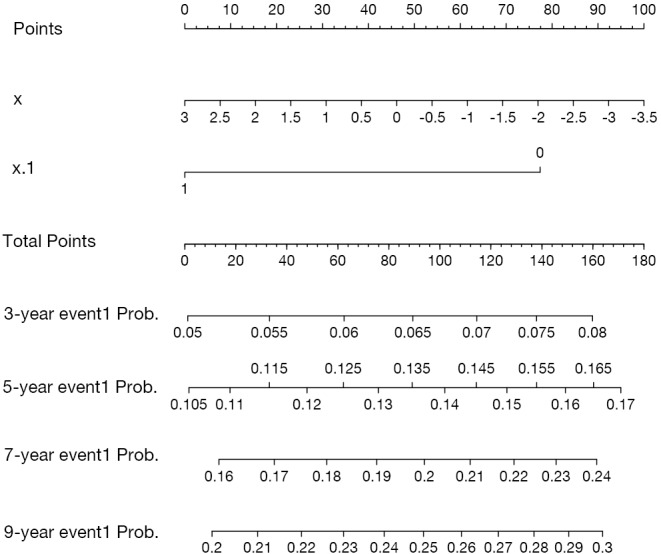
Figure 1.

Nomogram for probability of event 1 following start of follow-up in the presence of competing risks. Instruction for physician: locate a patient’s characteristics of x and x.1 on corresponding axis to determine how many points the patient receives for x and x.1. Sum the points achieved for each of x and x.1 and locate this sum on total points axis. Draw a line straight down to identify the patient’s probability of event 1 from 3 to 9 years.
