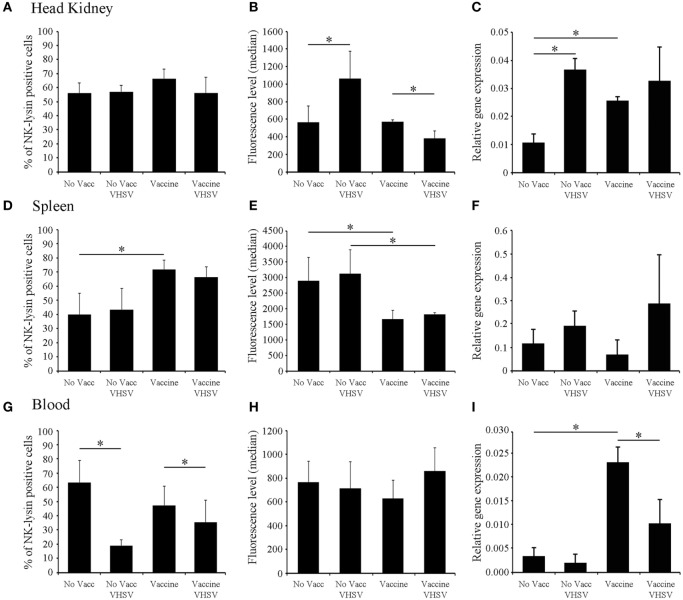
Figure 3.
Modulation of Nkl during vaccination and/or infection in different tissues by flow cytometry and qPCR. (A–C) head kidney; (D–F), spleen; (G–I), blood. (A,D,G) represent the percentage of Nkl-positive cells in the three tissues. (B,E,H) represent the median value of the intensity of fluorescence in positive cells in the three tissues. (C,F,I) represent the expression of nkl in the tissues by qPCR. The positive region in the FL1-H histogram was adjusted using the signal registered in the same samples stained with the preimmune serum. Gating values for the positive region were 300-9910 for the head kidney, 514-9910 for spleen, and 262-9910 for blood samples. In all figures, the mean value of six samples plus SD is represented. Asterisks indicate significant differences (p < 0.05) between experimental groups. Nkl, Nk-lysin; qPCR, quantitative polymerase chain reaction.

