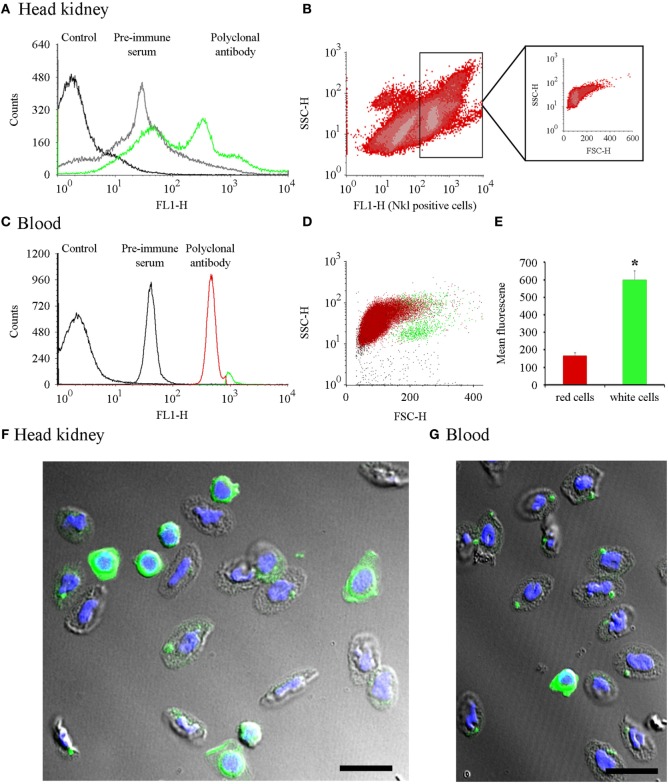
Figure 4.
Cell distribution of Nkl by flow cytometry in head kidney and blood samples and confocal images of cells stained with the anti-Nkl antibody. (A) A FL1-H histogram was used to compare the fluorescence profile of head kidney samples stained with the preimmune serum or the polyclonal antibody. FL1-H positive cells were gating at 300-9910. (B) Distribution of head kidney cell populations using SSC-H vs. FL1-H density plots. The FSC-H/SSC-H position of Nkl-positive stained cells is boxed. (C) Fluorescence profile of blood samples stained with preimmune serum and polyclonal antibody. Positive cells for Nkl were gated at 262-9910. (D) Dot plot representing the position of the two Nkl-positive cell populations (red: cell population enriched in erythrocytes or red cells; green: cell population enriched in white cells). (E) Mean fluorescence value registered in blood cell populations. Asterisks indicate significant differences (p < 0.05). (F,G) Confocal microscopy images of a head kidney and a blood sample, respectively, showing white and red cells stained with the anti-Nkl polyclonal antibody. Green: Nkl. Blue; DAPI. Scale bar, 10 µm. FSC, forward-light-scatter; Nkl, Nk-lysin; SSC, side-light-scatter.

