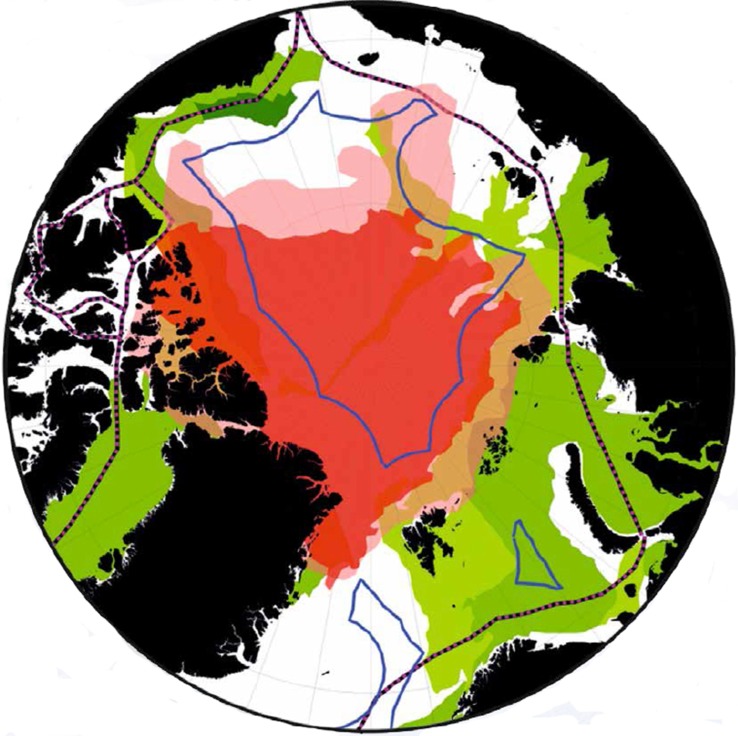
Fig. 4.
The Arctic Ocean showing areas of potential conflict. Pink shaded area shows the sea-ice extent in September 2010, while red shows the decreased extent in September 2012. Geological provinces in the Arctic with estimated significant undiscovered oil are shown in green (light green shows low potential, to dark green representing the highest potential). Blue line shows coastal states 200 M limits, while pink and black dashed lines show the Northern Sea Route and North West Passage, respectively

