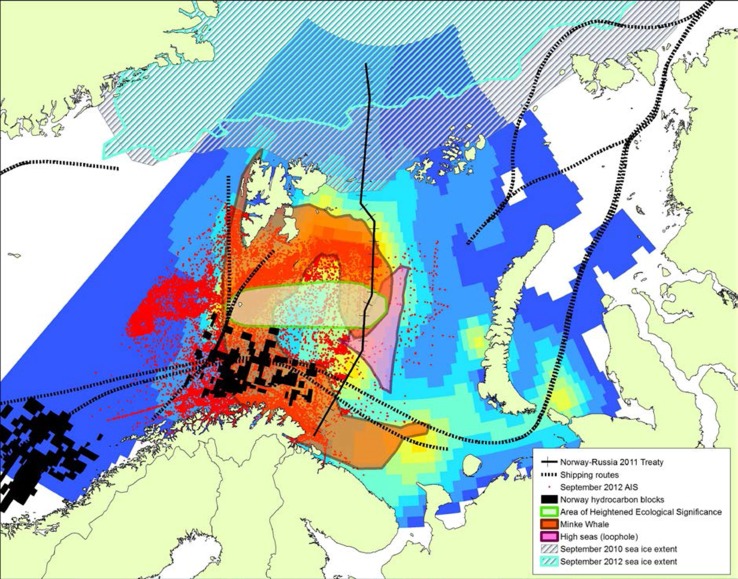
Fig. 6.
ArcGIS map showing different economic sectors in the Barents Sea. Coloured background grid shows predicted cod stocks for August 2057 (ACCESS report D3.11)—cold colours show low density, while warm colours show higher density. Red dots show vessel AIS data from September 2012 (ACCESS report D4.54), while dashed black lines show principal shipping routes. Maritime boundary between Norway and Russia is shown by the black ticked line, while the pink polygon shows the Loophole. Norwegian hydrocarbon exploration blocks are shown by black rectangles. Also shown are Minke Whale distribution, an ecologically significant area, and 2010 and 2012 summer sea-ice extents

