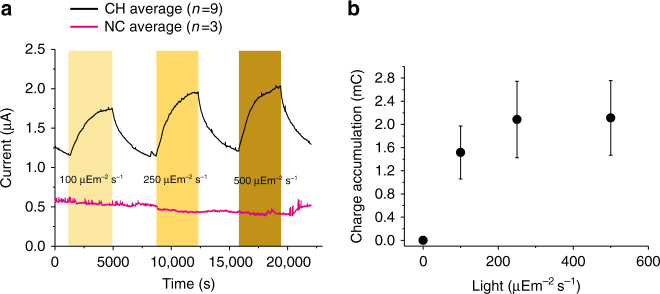
Fig. 3.
Effect of light intensity on anodic photocurrent produced by the hybrid BPV system. a Current output measured over 6 h with three periods of light and darkness (1 h each). Light periods indicated by the yellow bars. Black trace for inkjet-printed Synechocystis on printed CNT anode and magenta trace for control experiments without the printed cells. Number of repeats is indicated in parenthesis. b Saturation curve for the current outputs as presented in the a. For each period of light (100, 250 and 500 µE m−2 s−1), the current was integrated over time. The charge attributable to dark current over the same time was subtracted from the total charge during the light periods and plotted vs. the photon flux. Each data point is the result of 9 replicates and the standard error is shown as error bars

