Fig. 4.
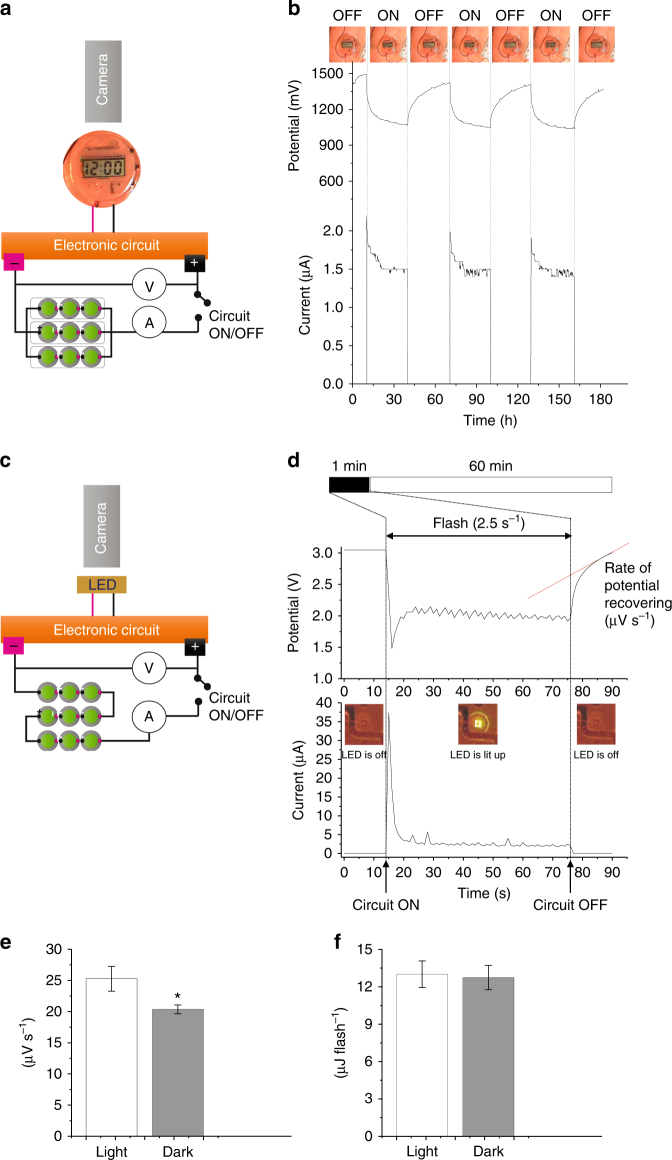
Powering a clock and a LED-flash with an array of Hybrid BPV units. a Schematic representation of the experimental setup for the powering of a digital clock. An array consisting of 9 Hybrid BPV cells were organised in 3 clusters connected in parallel. Each cluster had 3 units connected in series. b Chronovoltammetric and chronoamperometric traces recorded during the experiment where the circuit (i.e., the digital clock) was either on (i.e., clock activated) or off (i.e., clock deactivated) for periods of approximately 30 min. c Schematic representation of the experimental setup for the powering of a LED. The array was organised all in series. d Chronovoltammetric and chronoamperometric traces recorded during the experiment where the circuit with its integrated LED was either on (i.e., pulsing every 2.5 s to activate the LED) for periods of approximately 60 s or off (i.e., LED deactivated) for periods of approximately 1 h. Rate of voltage recovery was estimated by fitting the last 7 s of data with a linear regression line (in red); e kinetics of recovering to the original voltage following LED pulse when the BPV array was kept in the dark and when it was exposed to light; f average energy consumed for each LED pulse

