Fig. 4.
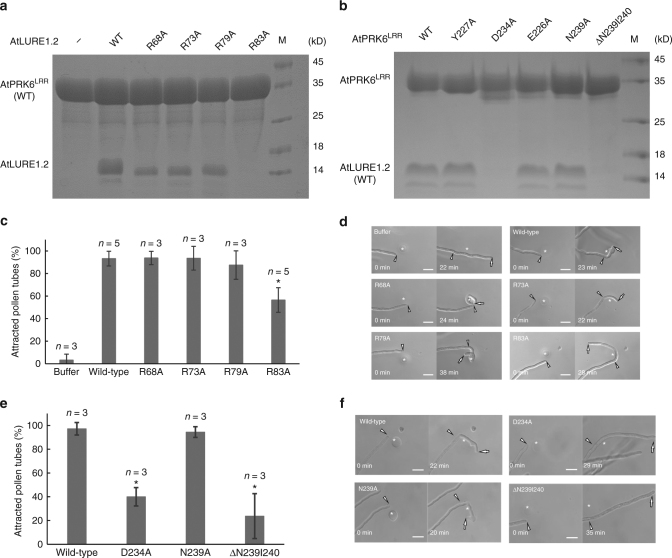
Mutagenesis analysis and pollen tube attraction with mutant AtLURE1.2 and AtPRK6. a Effect of AtLURE1.2 mutations on the interaction with AtPRK6LRR. The assay was performed as described in Fig. 1a. b Effect of AtPRK6LRR mutations on the interaction with AtLURE1.2. The assay was performed as described in Fig. 1a. c Attraction frequencies of pollen tubes by mutant AtLURE1 peptides. Attraction frequencies of semi-in-vivo pollen tubes were examined using gelatin beads containing 250 nM AtLURE1.2 peptides of wild-type and mutants, respectively. For each assay, 9–16 pollen tubes were examined, and assays were repeated 3−5 times in each condition. Data are mean and s.d., and numbers of assays (replicates) in each condition were indicated. An asterisk indicates statistical significance among wild-type and mutant AtLURE1.2 peptides (Tukey−Kramer test; P < 0.05). The frequency in R83A AtLURE1.2 was significantly lower than those in other four peptides. d Pollen tubes attraction in gelatin-beads assay. Photographs just after putting beads (0 min) and after attraction are shown. Arrowheads indicate the tip position when a bead was placed and arrows indicate the tip of attracted pollen tubes at the indicated time. The data are representative of 20−25 images. In the assay using R83A AtLURE1.2, more than 44% pollen tubes were not attracted to the bead. Scale bars are 20 μm. e Attraction frequencies of pollen tubes with mutations in PRK6 receptor. Attraction frequencies of semi-in-vivo pollen tubes (prk6 transformed with PRK6 of wild-type, D234A, N239A, and ΔN239I240) were examined using gelatin beads containing 250 nM wild-type AtLURE1.2 peptides. For each assay, 10–23 pollen tubes were examined, and repeated for three times in each condition. Frequencies in D234A and ΔN239I240 PRK6 pollen tubes were significantly lower than those in wild-type and N239A PRK6 pollen tubes. f Pollen tubes attraction in gelatin-beads assay. Photographs just after putting beads (0 min) and after attraction are shown. Arrowheads indicate the tip position when a bead was placed and arrows indicate the tip of attracted pollen tubes at the indicated time. The data are representative of 11−14 images. Scale bars are 20 μm

