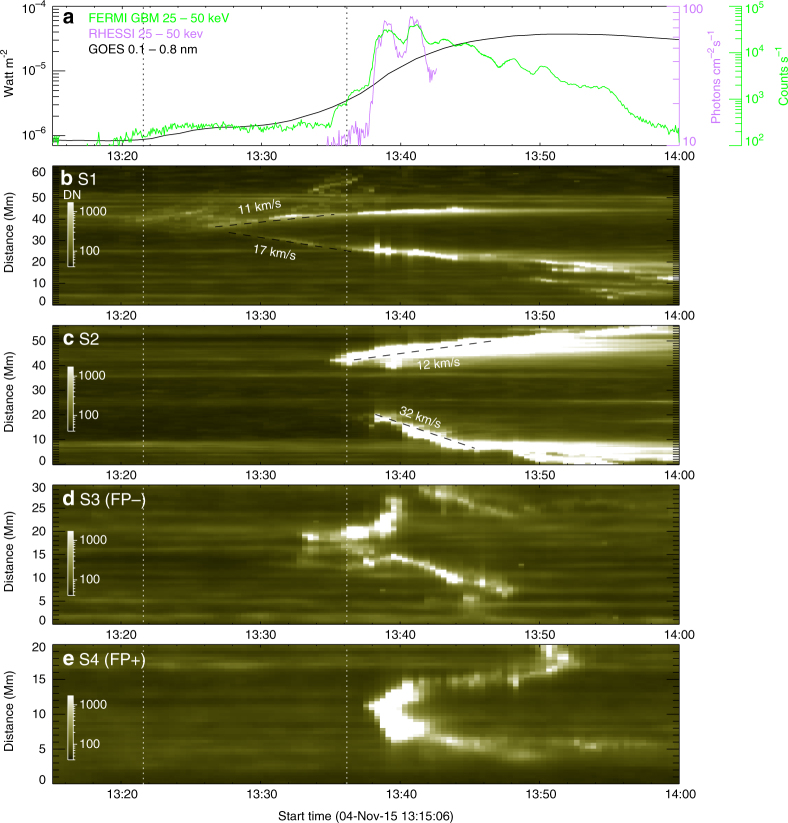
Fig. 3.
Temporal evolution of the flare ribbons in 1600 Å. a Shows 0.1–0.8 nm soft X-ray flux observed by the Geostationary Operational Environmental Satellite (GOES), 25–50 keV hard X-ray (HXR) count rate observed by the Gamma-ray Burst Monitor (GBM) onboard the Fermi Gamma-Ray Space Telescope, and 25–50 keV HXR photon flux observed by the Reuven Ramaty High-Energy Solar Spectroscopic Imager (RHESSI). b–e Show the evolution of the flare ribbons as seen through slits S1 and S2 indicated in Fig. 2a, and of the bright rings as seen through slits S3 (for FP−) and S4 (for FP+) indicated in Fig. 2b, f, respectively. The first vertical dotted line marks the onset of the flare with the initial appearance of flare ribbons; the second line marks the onset of the flare main phase characterized by rapid ribbon separation c and non-thermal HXR production a

