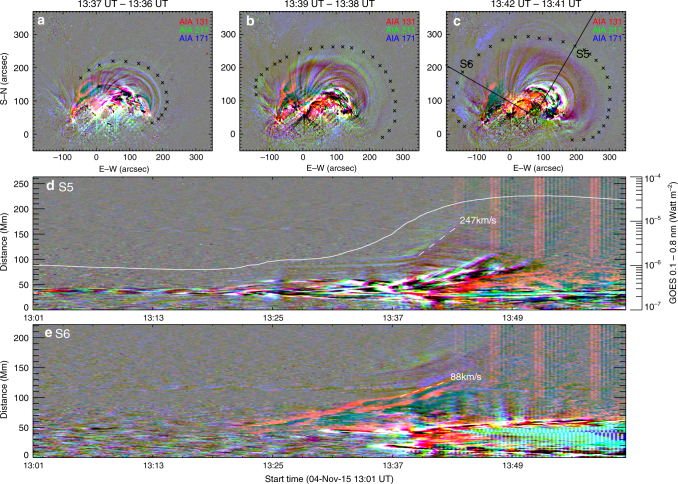
Fig. 5.
Eruptive structure in the solar eruption on 4 November 2015. a–c Show composite difference images in three Atmospheric Imaging Assembly (AIA) passbands, 171 (blue), 211 (green), and 131 Å (red). d, e Show the evolution of the eruptive structure as seen through the virtual slits S5 and S6 indicated in c. Linear fittings give the projected speeds of the features of interest (marked by dashed lines). The magnetic flux rope (MFR) is visible in 131 Å. Its eastern leg possesses a peculiar fork-like feature, which is shown as two semi-parallel red strips in the time-distance map e constructed via the silt S6 that crosses the fork. The wavefront (marked by crosses in a–c) ahead of the MFR is mainly visible in 171 and 211 Å, therefore appearing greenish

