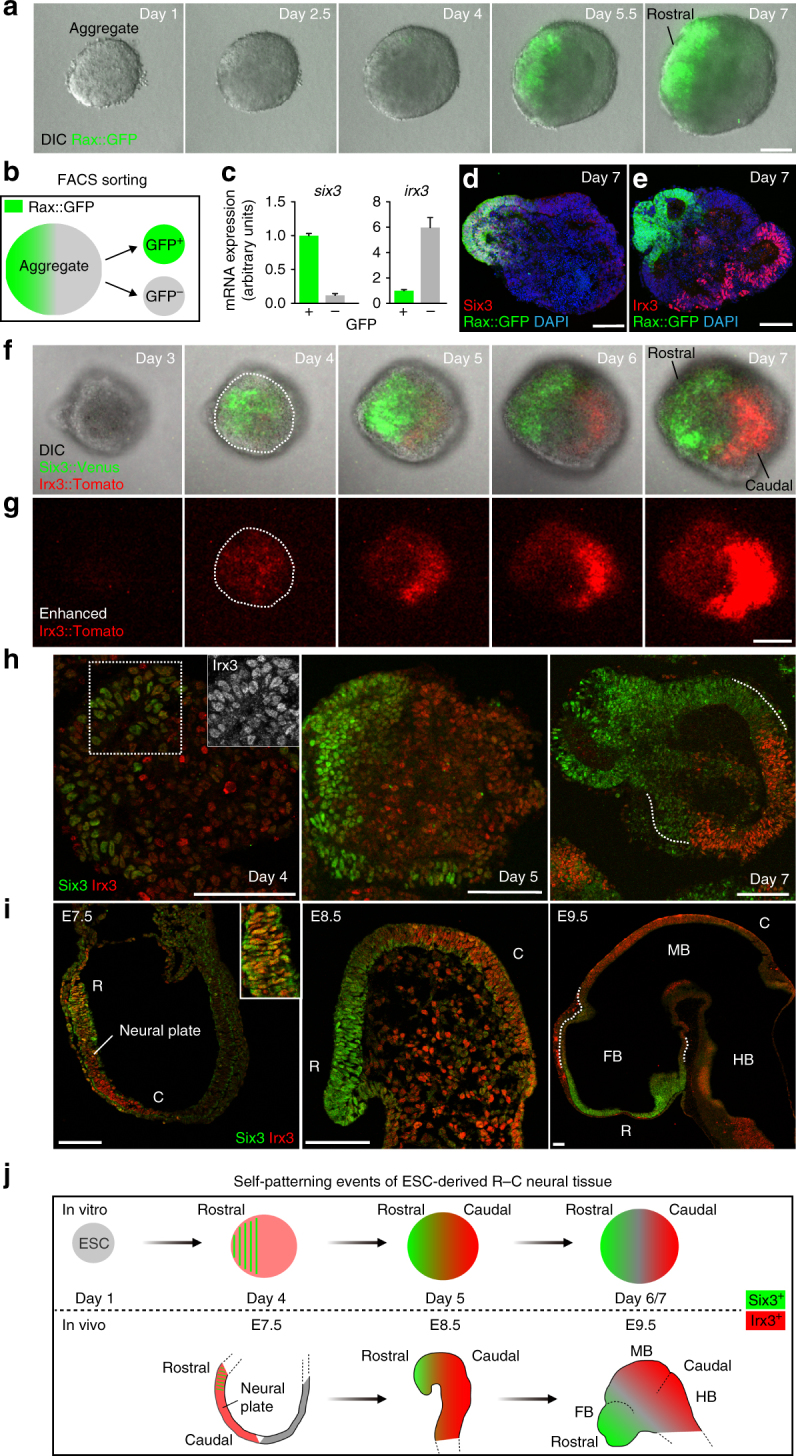
Fig. 1.

Self-patterning of rostral-caudal neuroectoderm in 3-D ESC culture. a Montage of images taken from Supplementary Movie 1, showing merged images of differential interference contrast (DIC) and Rax::GFP expression in the SFEBq aggregates, and epithelial structure formation around day 4. b Diagram of cell sorting of day-7 aggregates via fluorescence activated cell sorting (FACS) using the Rax::GFP ESC line. c Quantification of six3 and irx3 expression via RT-qPCR, following FACS sorting of GFP+ and GFP− cells. Error bars indicate standard error of the mean (s.e.m) of each FACS-sorting experiment. Data represent mean ± s.e.m. d, e Immunohistochemistry was performed on cryosections of day-7 Rax::GFP aggregates using antibodies recognizing GFP, Six3 and Irx3. DAPI was used for counter staining. f Montage of images taken from Supplementary Movie 2, showing DIC, Six3::Venus and Irx3::Tomato expression. g Montage of images taken from Supplementary Movie 2, showing enhanced time-lapse images of Irx3::Tomato expression via ImageJ software to see a dim expression. Dotted lines in day-4 images show outline of aggregates (f, g). h, i Immunostaining of cryosectioned day-4, -5 and -7 aggregates (h); E7.5, 8.5 and 9.5 embryos (i), showing Six3 and Irx3 staining. R, rostral; C, caudal; E. embryonic day. A dotted square in day-4 aggregate (h) corresponds to a single channel image of Irx3 (white) shown via an inset. Dotted lines in day-7 aggregate (h) and E9.5 embryo (i) show the regions of weak Six3 expression. j Schematic diagram of in vitro and in vivo rostral-caudal NE formation. ESC, embryonic stem cell; FB, forebrain; MB, midbrain; HB, hindbrain. Scale bars, 100 µm (a, d, e, g, h, i). These images were one of n = 3 experiments (a, d–i)
