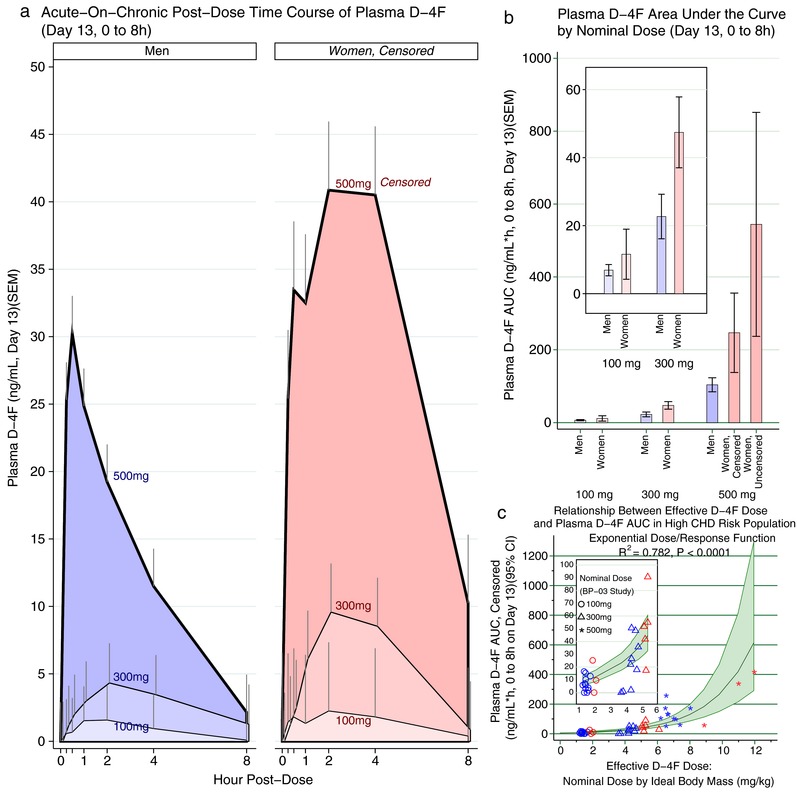
Figure 1.

(a) The time course of plasma D‐4F is presented for subjects with detectable levels over 8 h on day 13 by nominal D‐4F dose and gender. D‐4F was given at hour 0. As expected, exposure to higher nominal doses of D‐4F resulted in greater plasma D‐4F levels. Concentrations also differed between men and women, the latter achieving higher D‐4F levels, especially at the higher doses. Among women, the 500 mg group is censored, having excluded a woman with extraordinarily high D‐4F levels, thus underestimating the full effect of 500 mg on women. (b) The area under the curve (AUC) was determined over 8 h on day 13, and is again presented by nominal D‐4F dose and gender. Here, it was practical to present the women exposed to 500 mg as censored and uncensored bars for comparison. Consistent with a, women had higher D‐4F AUC. Because the uncensored analysis compresses the other bars, the inset presents the 100 mg and 300 mg groups separately for clarity. (c) We modeled the dose/response curve between effective D‐4F oral dose and plasma exposure as D‐4F AUC. The optimal fit was obtained by effective D‐4F dose in mg D‐4F per kg ideal body mass, rather than the nominal D‐4F dose (P < 0.0001; R2 = 0.78). See Supplementary Table S3 for details. The dose/response relationship was greater than linear with no evidence of a plateau at the upper end of the dosing range; as such, an exponential function provided a better fit than a straight‐line function. The blue markers indicate men and the red indicate women. CHD, coronary heart disease; CI, confidence interval.
