Figure 4.

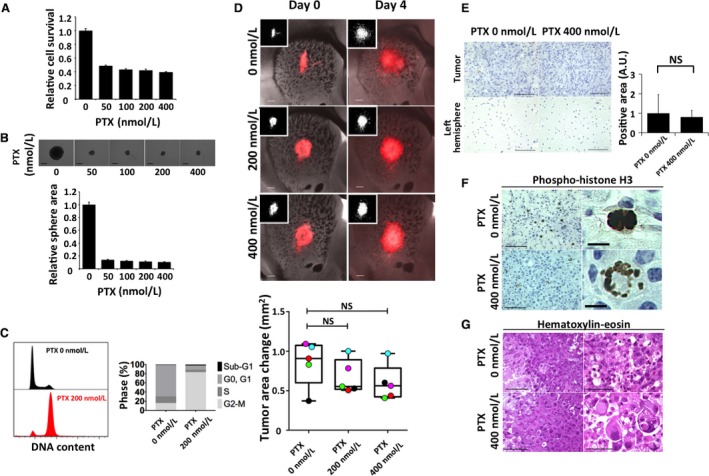
Effects of paclitaxel (PTX) on RasR cells. (A) Relative survival of RasR cells exposed to the indicated concentrations of PTX for 24 h. (B) Relative sphere growth after drug treatment for 7 days. Representative images of spheres are also shown. Scale bars, 300 μm. (C) Flow cytometric analysis of cell cycle profile for RasR cells exposed to 0 or 200 nmol/L PTX for 15 h. (D) Overlay of red fluorescence and phase‐contrast images (or fluorescence images alone [insets]) for explants exposed to the indicated concentrations of PTX for 0 or 4 days. Scale bars, 300 μm. The change in tumor area between day 0 and day 4 is also shown in a box‐and‐whisker plot with individual values represented by colored circles. Immunohistochemical staining for cleaved caspase 3 (E) or for phosphorylated histone H3 (F) as well as H&E staining (G) performed after fixation on day 4 for tumor‐bearing explants from (D). Scale bars: 100 μm [(E) and left panels in (F) and (G)], 50 μm [right panels in (G)], or 10 μm [right panels in (F)].
