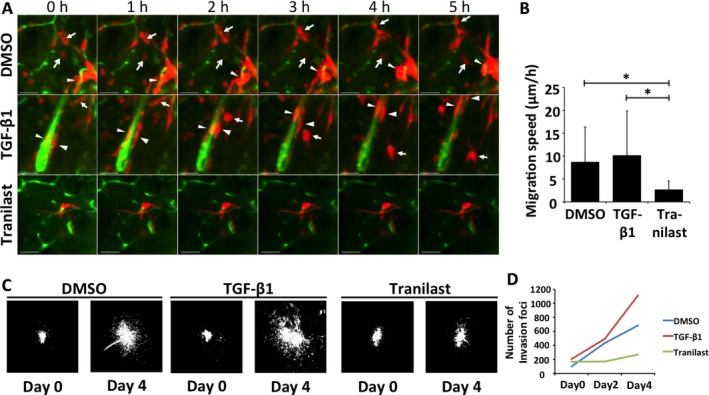
Figure 5.

Invasion analysis of RasR cells ex vivo. (A) Sequential images showing the movement of RasR cells (red) along vascular structures visualized with FITC‐conjugated antibodies to Sca1 (green). Explants were treated with DMSO, TGF‐β1 (5 ng/mL), or tranilast (1 mmol/L) for the indicated times. The arrows and arrowheads indicate individual migrating tumor cells. Scale bars, 50 μm. (B) Average speed of invading tumor cells determined as in (A). *P < 0.05. (C) Fluorescence signals of tumors at the beginning (day 0) and end (day 4) of explant treatment as in (A). (D) Average number of small invasion foci within the composite fields shown in (C).
