
Figure 5.
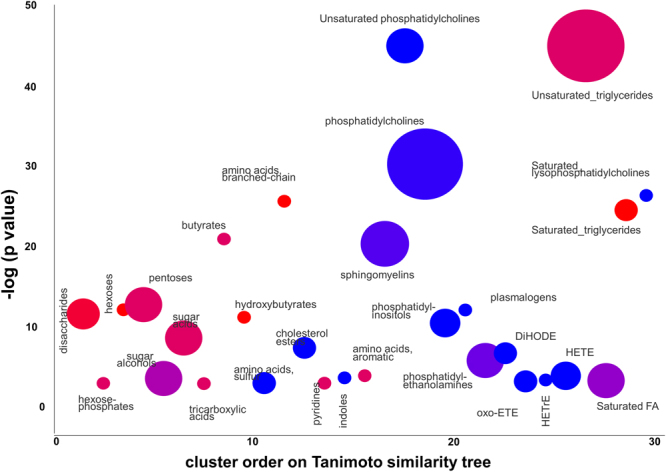
ChemRICH set enrichment statistics plot. Each node reflects a significantly altered cluster of metabolites. Enrichment p-values are given by the Kolmogorov–Smirnov-test. Node sizes represent the total number of metabolites in each cluster set. The node color scale shows the proportion of increased (red) or decreased (blue) compounds in diabetic NOD mice compared to control mice. Purple-color nodes have both increased and decreased metabolites.