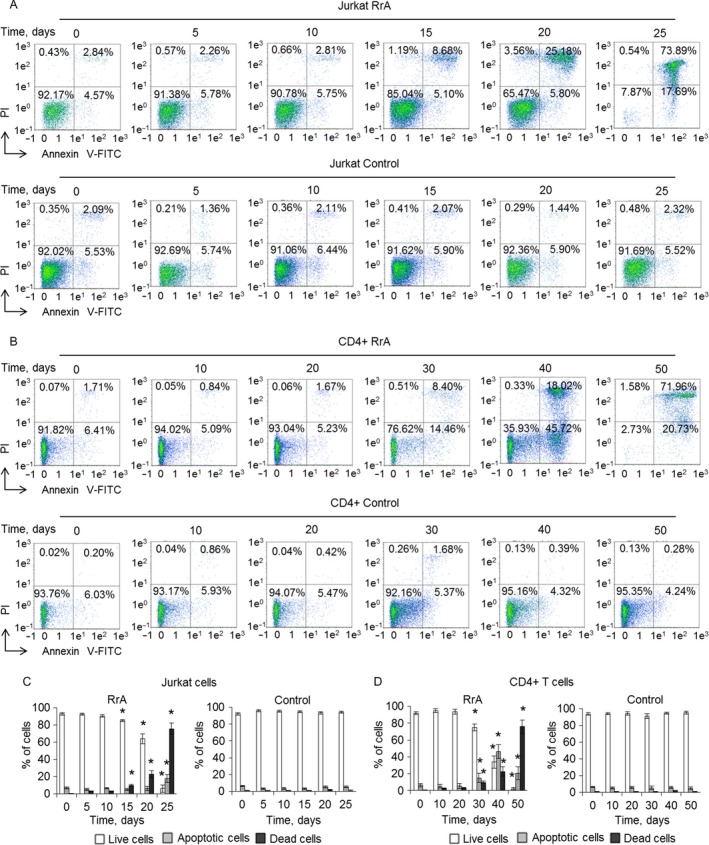
Figure 4.

Induction of Jurkat cells’ and normal CD4+ T cells’ killing during cultivation with RrA. Flow cytometry results of (A) Jurkat cells and (B) CD4+ T cells incubated with RrA and labeled with Annexin V‐FITC and PI. Ratio of live cells (low left quadrants), apoptotic cells (low right quadrants), and dead cells (two upper quadrants) are presented. Histograms of live, apoptotic, and dead (C) Jurkat cells and (D) CD4+ cells. N = 4. *P ≤ 0.05 versus control cells.
