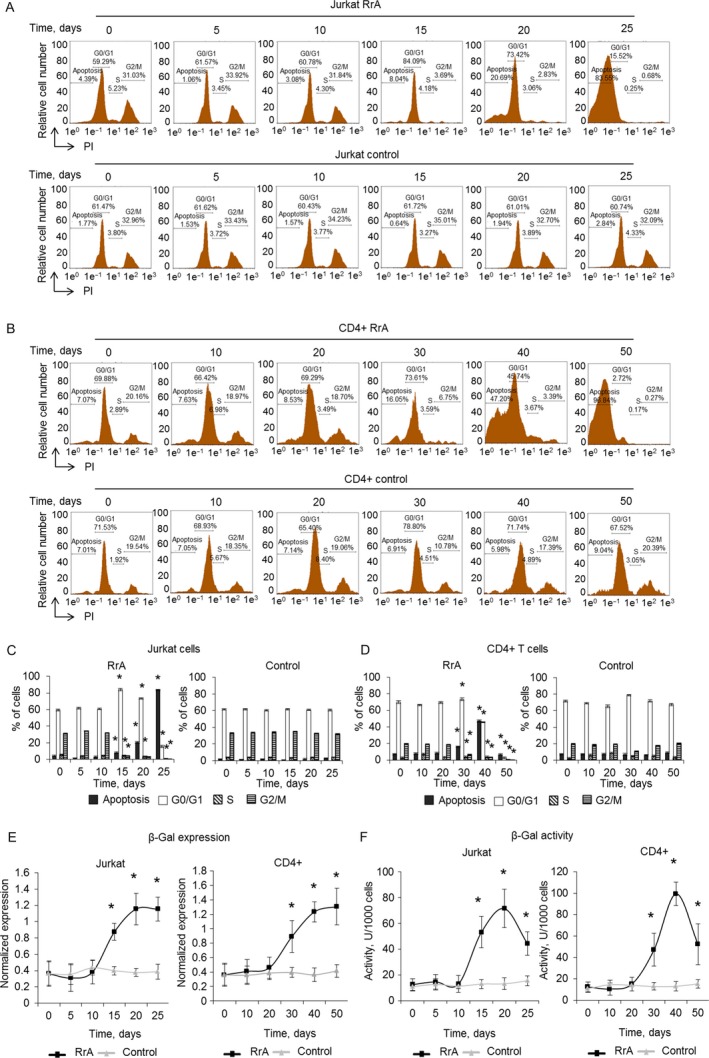
Figure 5.

Inhibition of cell cycle and conversion of cells into the replicative senescent state. Results of cell cycle measured by flow cytometry and labeling of cell DNA with PI. Proportion of (A) Jurkat and (B) CD4+ cells in apoptotic state as well as in G0/G1, S and G2/M phases of cell cycle are presented. (C, D) Histograms of proportions of cells in different phases of cell cycle. (E) β‐Gal expression levels in Jurkat and CD4+ T cells cultivated with RrA. Levels of β‐Gal gene expression were normalized relative to the expression of reference gene 18S. (F) Enzymatic activity of β‐Gal in Jurkat and CD4+ T cells. β‐Gal activity is presented as U for 1000 cells which was determined by the calibration curve. *P ≤ 0.05 versus control cells.
