Figure 3.
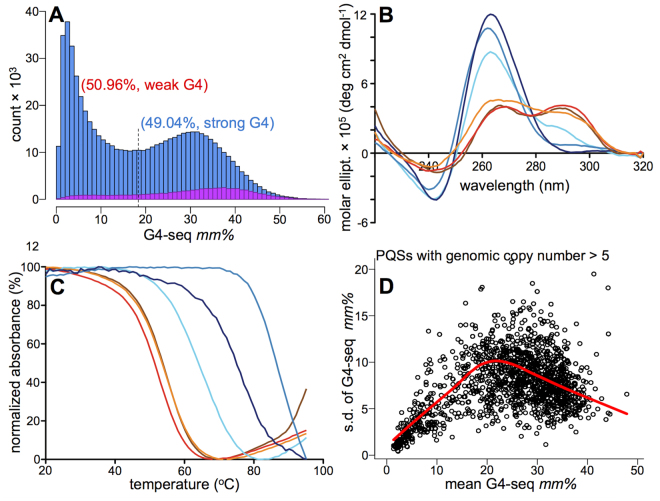
Canonical putative quadruplex sequences do not necessarily form stable genomic G4s. (A) The distribution of mm% values for PQSs, highlighting the presence of two clusters. (B) Example CD spectra for sequences from the weak- (shades of red) and strong-G4 (shades of blue) clusters (as judged from G4-seq mm% values). The CD signature for G4 comprises ~260 nm maximum and ~240 nm minimum for parallel topology, or ~290 nm maximum and ~260 nm minimum for antiparallel topology42,43. (C) The example UV-melting (for 295 nm) spectra from the same sequences in (B). The chosen sequences with their respective mm% and Tm (UV melting temperature) values are highlighted in Table S1, using the same colour code. The increased absorbance for some samples, after the full melting of G4 structures, is most probably due to a partial evaporation from the solution during the continuous measurement at high temperatures. (D) The G4-seq mm% variance vs. mean value dependence for PQSs with multiple genomic copy numbers, where only the flanking sequences are different, to directly demonstrate the role of flanks on G4 formation propensity. See also Figures S10–S14, Tables S1 and S2.

