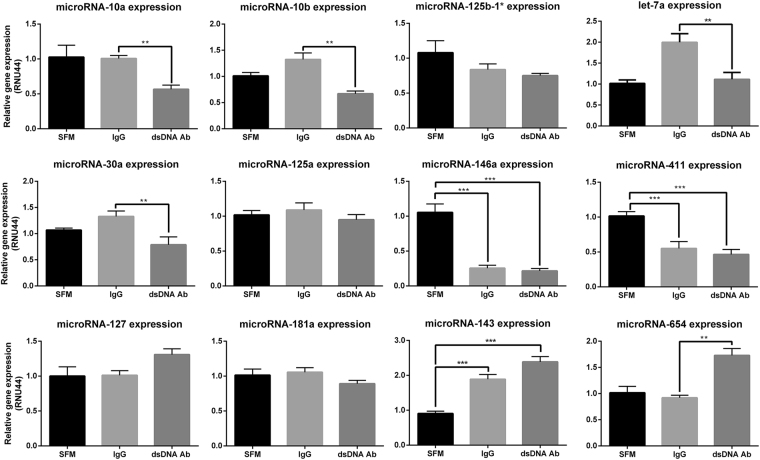
Figure 2.
Candidate miRNAs expression in HMCs treated with anti-dsDNA IgG antibodies. Graphs show miRNA expression in HMCs treated with anti-dsDNA IgG antibodies (10 µg/mL) for 3 hours using stem-loop Real-Time PCR and qPCR. Data are normalised with RNU44 expression and compared with untreated conditions (SFM). Data are analysed using unpaired Student’s t-test and expressed as the mean ± SEM. *P < 0.05, **P < 0.01 and ***P < 0.001 versus normal healthy IgG controls.

