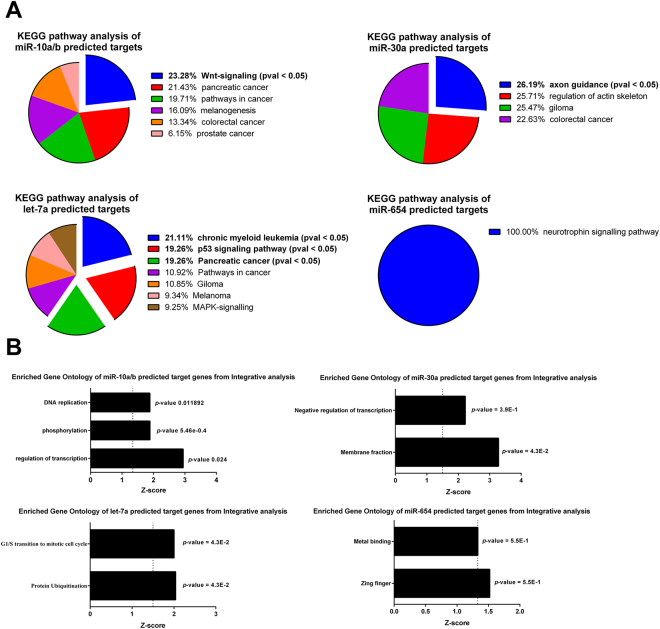
Figure 4.
KEGG pathway analysis and functional annotation clustering of predicted/validated target genes of candidate miRNA that differentially expressed in activated HMCs. (A) Pie charts show KEGG pathway analysis from integrative analysis between predicted/validated target genes of miR-10a/b, miR-30a, miR-654 and let-7a with anti-dsDNA IgG antibodies stimulation transcriptomic. (B) The graph represents gene functional annotation clustering of integrative analysis between candidate miRNA (miR-10a/b, miR-30a, miR-654 and let-7a) and microarray mRNA data using ingenuity pathway analysis (IPA, Qiagen) with negative correlation and high-to-medium confidence target prediction. The prediction criteria are based on TargetScan.

