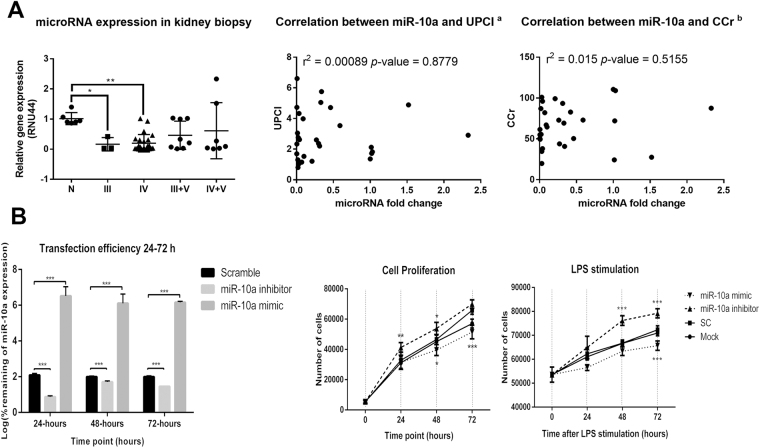
Figure 5.
The miR-10a expression in kidney biopsy from LN patients and the effect of miR-10a inhibitor or miR-10a mimic transfection in human mesangial cell proliferation. (A) (Left) miR-10a expression in kidney biopsies from lupus nephritis (LN) patients grouped by histology class including class III (n = 3), IV (n = 23), III + V (n = 8), and IV + V (n = 8) compared with cadaveric donor kidney biopsies (n = 6). Expressions are normalised to RNU44 expression. Graphs show the correlation between miR-10a expression and disease severity determined by urine protein creatinine index (UPCI)a (Middle) or creatinine clearance (CCr)b (Right). (a) There are missing data for UPCI and miR-10a expression correlation. We conducted this correlation only from 29 samples. (b) The correlation was performed using data from 29 samples. (B) (Left) The graph shows the log percent remaining of miR-10a expression after miR-10a inhibitor or miR-10a mimic transfection compared with scramble negative controls at different time points (24, 48 and 72 hours). (Middle) Cell proliferation assay using human mesangial cells (HMCs) transfected with miR-10a inhibitor (▲), miR-10a mimic (▼), scramble negative control (■) and lipofectamine or mock control (●) at different time points (0, 24, 48 and 72 hours). (Right) The cells were stimulated with LPS before proliferation assay. The cell number was compared between samples at the same time points using an unpaired Student’s t-test. Data were analysed using the Mann-Whitney U-test in tissue samples and are expressed as the mean ± SEM. (*) denotes P < 0.05, and (**) denotes P < 0.01 versus cadaveric donor kidney or scramble controls.

