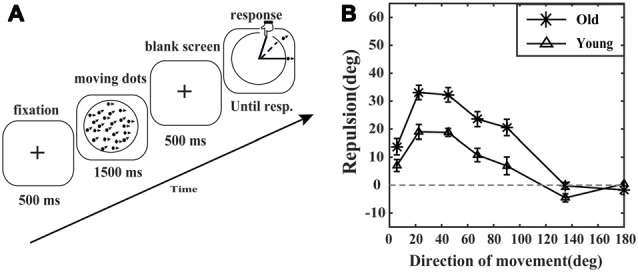
Figure 1.

Motion repulsion experiment paradigm and results. (A) A schematic of the motion repulsion experiment. Each trial began with a fixation point followed by two superimposed moving random dot kinematograms (RDKs). The reference RDKs always moved horizontally to the right. The moving direction of the target RDKs was varied trial-by-trial. The observer was required to report the perceived moving direction of the target RDKs by touching the corresponding point on the circle with his or her finger. (B) Motion repulsion plotted as a function of the moving direction of the target RDKs. Motion repulsion was calculated as the difference between the perceived and actual angles of the target RDKs. Data points represent the average motion repulsion of the elderly (asterisk marker, N = 11) and young adults (triangle marker, N = 11). Error bars represent the SEM.
