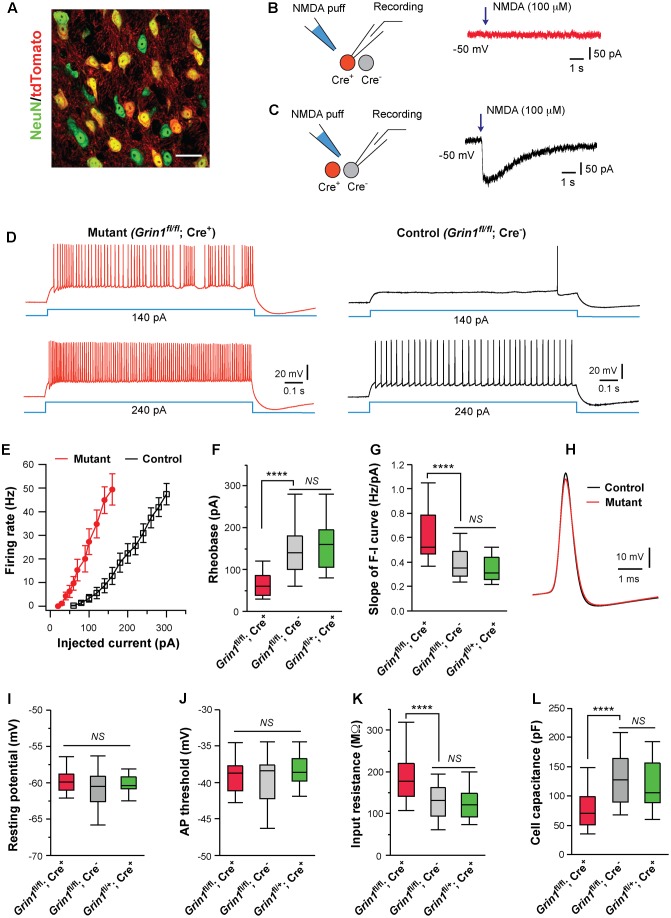
FIGURE 1.
Cell autonomous effects of NMDAR deletion on intrinsic excitability of thalamic relay neurons. (A) Confocal image of VPm neurons in a SERT-Cre; RosaAi14 mouse at P14. The section was immunostained for NeuN (green). Scale bar: 30 μm. (B,C) Current responses to pressure applications of NMDA (100 μM, 200 ms puff) in a mutant neuron (Grin1fl/fl; Cre+) and a control neuron (Grin1fl/fl; Cre-), respectively, in a SERT-Cre; Grin1fl/fl; RosaAi14 mouse at P15. (D) Firing patterns of a mutant neuron (traces in red on the left) and a control neuron (traces in black on the right) in a SERT-Cre; Grin1fl/fl; RosaAi14 mouse at P15. The membrane potential of the cells was adjusted to –60 mV before each current step. (E) The F-I curves for control and mutant neurons recorded from SERT-Cre; Grin1fl/fl; RosaAi14 mice at P14-16. (F) Rheobase of mutant (Grin1fl/fl; Cre+), control (Grin1fl/fl; Cre-), and Cre+ control neurons (Grin1fl/+; Cre+) recorded at P14-16 (∗∗∗∗p < 0.0001; NS, p = 0.35, Wilcoxon test). (G) Slope of the F-I curve of the three groups (∗∗∗∗p < 0.0001; NS, p = 0.14, Wilcoxon test). (H) Examples of action potentials from mutant (red) and control (black) neurons. (I) Resting potential of the three groups (NS, p = 0.53, Wilcoxon test). (J) AP threshold of the three groups (NS, p = 0.34, Wilcoxon test). (K) Input resistance of the three groups (∗∗∗∗p < 0.0001; NS, p = 0.11, Wilcoxon test). (L) Whole-cell capacitance of the three groups (∗∗∗∗p < 0.0001; NS, p = 0.61, Wilcoxon test). Data in (F,G,I-L) are presented as median with interquartile range and the minimum and maximum (box and whisker plot). Data were collected from 22 mutant neurons (Grin1fl/fl; Cre+) and 27 control neurons (Grin1fl/fl; Cre-) from 13 mice, and 19 Cre+ control neurons (Grin1fl/+; Cre+) from 7 mice.

