
Figure 4.
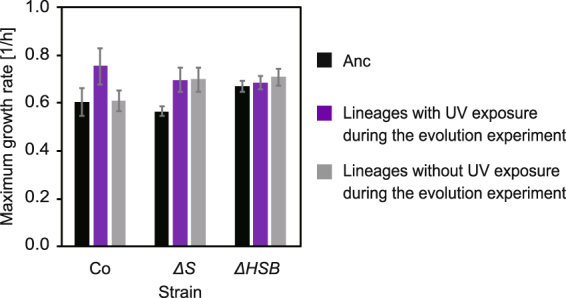
Growth characteristics of evolved strains. The final populations in the evolution experiment (the lineages with or without UV exposure on day 28) were compared with their ancestral strains. The bars for Anc were replotted from Fig. 1b for reference. The mean values were calculated for six lineages of each evolved strain. The error bars represent standard deviations. The maximum growth rates significantly increased compared to the ancestors after the evolution experiments (t-test, p < 0.05) except for the lineages of Co without UV exposure during the evolution experiments.