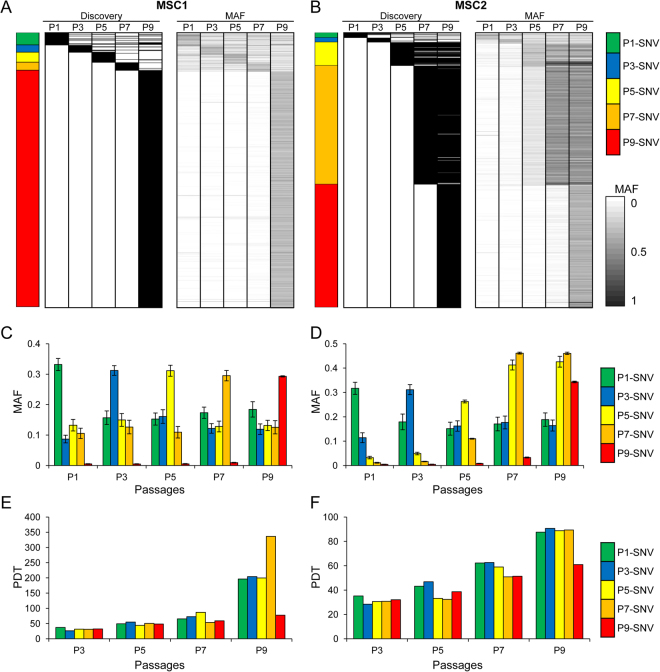
Figure 5.
Clonal analyses of mutations. (A) Each row (horizontal line) represents an individual SNV identified in MSC1. The two heatmaps show the passage at which the corresponding mutations were identified (“Discovery”; left) and the MAF or mutation allele frequencies across the passages (“MAF”; right), respectively. A colored bar (left) indicates the passage assigned to the individual SNVs. If a single mutation was identified at multiple passages, the mutation was assigned to the earliest passage. Mutations of P1 (green), P3 (blue), P5 (yellow), P7 (orange), and P9 (red) are distinguished with respective colors. (B) The mutations identified in MSC2 are similarly shown. (C) Mean of MAFs are plotted for five mutation classes (P1–P9 with respective colors) across five passages of MSC1. Error bars represent the standard error. Except for the P9 mutations (red) whose MAF abruptly increased at P9, P1-P7 mutations show a fluctuation of MAFs across the passages. (D) Similarly shown for the MAF of five mutation classes (mean values with standard error) of MSC2. (E and F) Mean of simulated values of the PDT are plotted for five mutation classes of MSC1 (E) and MSC2 (F).

