Figure 2.
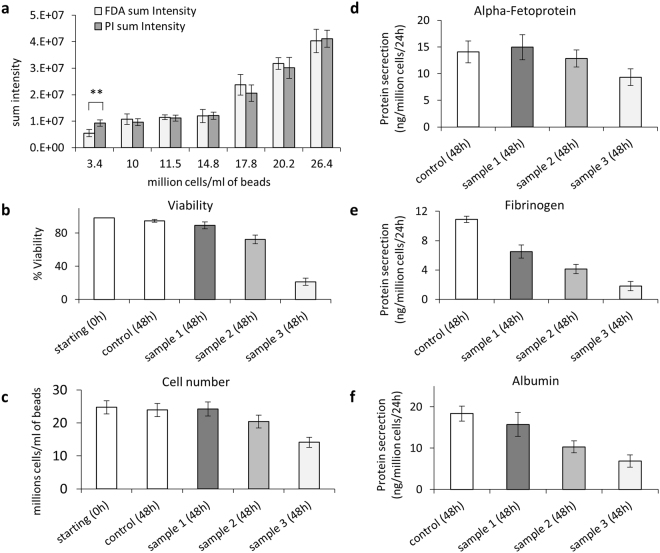
(a) Quantitation of fluorescent signal for cell spheroid viability assay. Sum intensity of FDA and PI signal for alginate encapsulated cell spheroids (AELS) of increasing cell density, indicating that during the whole bioprocess production the quantitation of live/dead cells was insensitive to changes in cell density, demonstrating equivalency of intensity of PI/FDA output, with the exception of the lowest cell density (difference between FDA and PI signal at 3.4 million cells per ml beads, p < 0.05). (b) Viability determined by image analysis compared to cell number (c), protein secretion (d–f) Sample 1, 2 and 3, treated with high Me2SO to progressively reduce cell viability (5, 10, and 15 minutes in ice-cold 50% Me2SO (w/v)) and a positive control (untreated cells) were tested 48 hours after treatment. Viability, cell number and protein secretion per cell decreased for samples in the order 1–3. Data was n = 5, ± SD.

