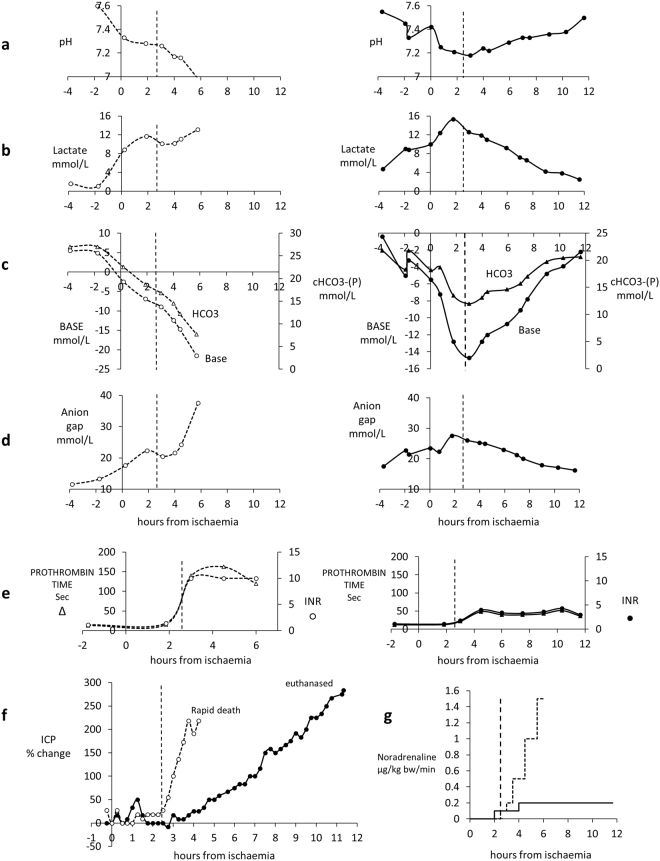
Figure 9.
(a–g) Comparison of parameters of severity of acute liver failure in control empty bead BAL (-o-) treated pig vs. Cell-BAL treated pig (•), with similar degrees of liver dysfunction prior to connection to the BAL. BAL treatment started at 2.5 h. Both pigs had same ammonia levels at connection to the BAL. Control-treated pig survived 6 h after liver failure induction, Cell-treated pig survived >12 h after liver failure induction. Vertical dashed line signifies time at which BAL was added. (a) pH (b) Lactate. (c) Base and bicarbonate. (d) Anion gap. (e) Prothrombin time and INR. (f) ICP change from baseline. Control-BAL (○) exhibited a rapid rise in ICP compared with Cell-BAL (●), i.e. Control-BAL 154% change from baseline per hour; Cell-BAL 25% change from baseline per hour. (g) Vasopressor requirements: noradrenaline was administered IV at rates required targeting a cerebral perfusion pressure (CPP) of 60 mmHg, so the blood pressure was optimised depending on the ICP.

