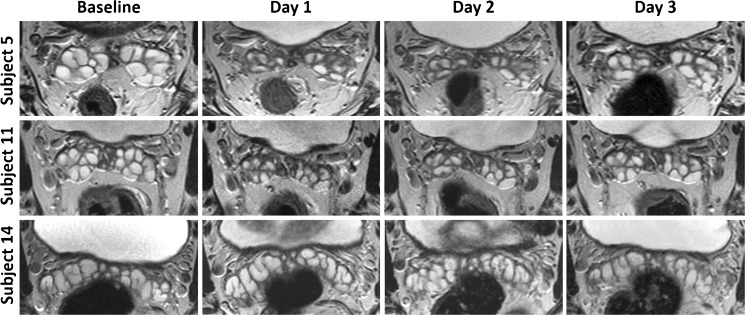
Fig. 2.
Examples of seminal vesicle volume change over time. Axial T2-weighted MR imaging performed at baseline (minimum 3 days post-ejaculation), and post ejaculation on days 1, 2 and 3. Top row subject 5 (aged 27) shows significant reduction in volume from a baseline of 9.7 cm3 to 3.6 cm3 on day 1 and subsequently to 4.7 cm3 and 6.9 cm3 on days 2 and 3, respectively. Middle row subject 11 (age 53) shows similar reductions from 7.0 cm3 at baseline to 3.3 cm3, 4.2 cm3 and 5.3 cm3 on days 2, 3 and 4, respectively. Note apparent increase in wall thickening on day 2, due to relative underdistension. Bottom row subject 14 (age 36) shows little difference in SV volume over the four scans: 10.6 cm3, 10.0 cm3, 10.5 cm3 and 10.9 cm3, respectively

