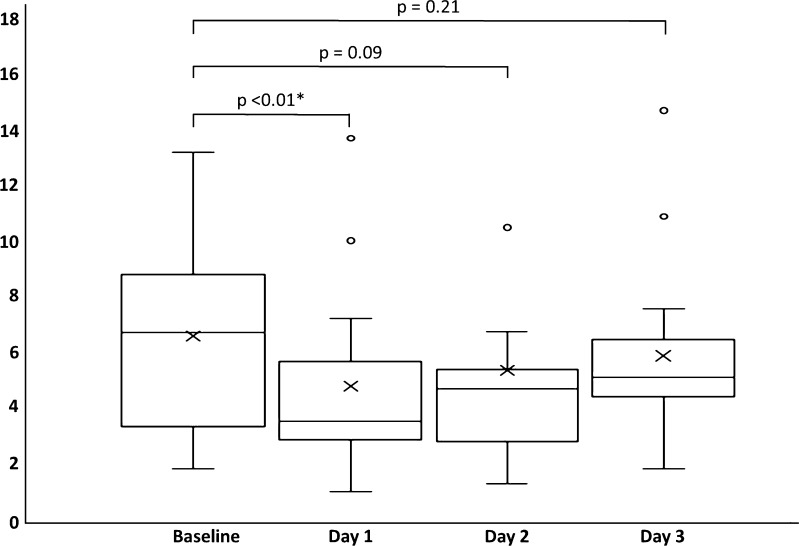
Fig. 3.
Box and whisker plots of seminal vesicle fluid volumes between each of the four scans. Top and bottom of boxes represent 25th and 75th percentiles of data, X in boxes represents mean, with line representing median value and bars representing data within 1.5 times interquartile range. Circles denote outliers. p values are shown for inter-group comparisons, *p < 0.05

