Fig. 4.

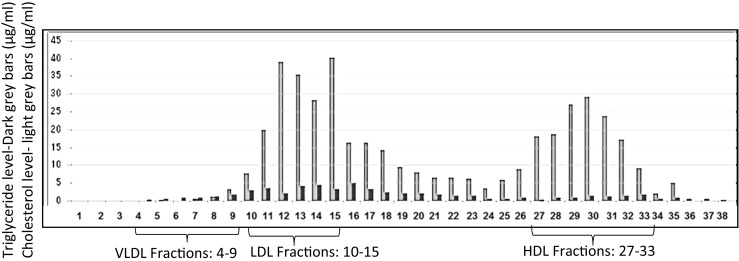
The chart shows which fractions are related to VLDL, LDL, and HDL, based on size exclusion chromatography and cholesterol analysis

The chart shows which fractions are related to VLDL, LDL, and HDL, based on size exclusion chromatography and cholesterol analysis