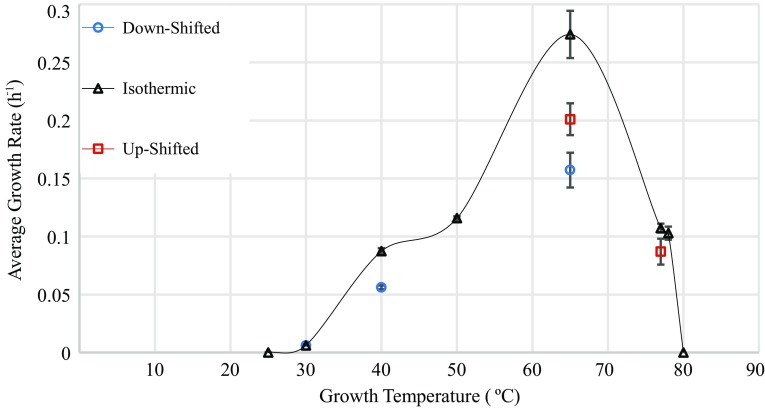
Fig. 1.
Growth rate of K. olearia as a function of temperature. Isothermic growth curves were generated at each temperature from an inoculum grown at that temperature for at least three transfers (except for 25 and 80 °C, for which an inoculum from the same temperature could not be generated; see “Materials and methods”). Up-shifted and down-shifted growth curves were generated from an inoculum that was grown at lower and higher temperatures, respectively. Red squares growth temperature up-shifted from 65 to 77 °C or from 40 to 65 °C, blue circles growth temperature down-shifted from 77 to 65 °C, 65 to 40 °C, or 40 to 30 °C. Data points represent the mean of replicate cultures (see “Materials and methods”); error bars represent standard error

