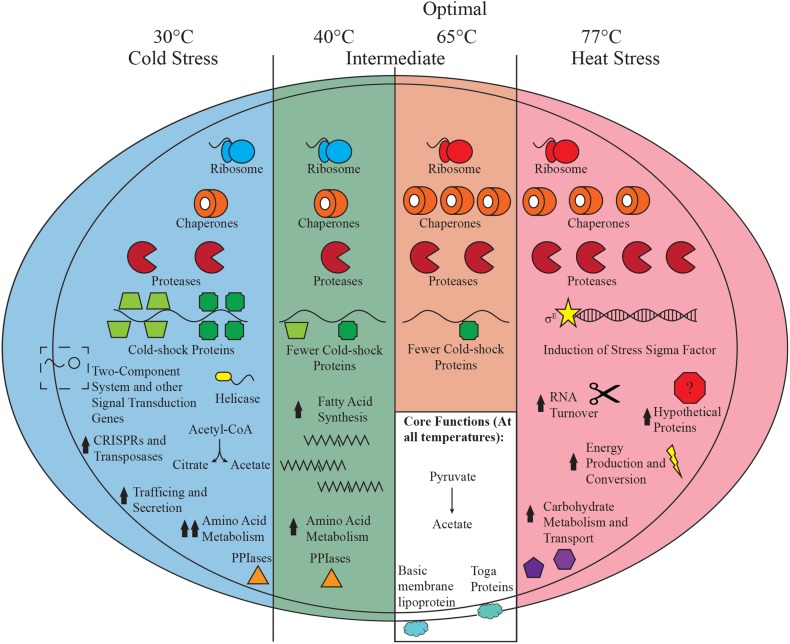
Fig. 5.
Schematic of K. olearia’s major temperature-induced transcriptional responses. Major responses outlined in the text occurring in the three states observed are shown. The number of chaperone, protease, and cold-shock symbols reflects their relative expression at each temperature. Chaperones include groEL (Kole_1627), groES (Kole_1626), and dnaK (Kole_0886). Proteases refer to protease Do (Kole_1599) and protease La (Kole_0536). Cold-shock genes consist of Kole_2064 (dark green squares) and Kole_0109 (green trapezoids). The different colored ribosomes represent changes in ribosomal protein composition at sub-optimal temperatures (see text for “Discussion”). The putative two-component regulatory system (Kole_1015–1017) that had a dramatic increase in expression under cold stress is shown. Prominent changes in functional categories (COGs) for each temperature condition are also shown. Arrows indicate relative gene expression when compared to growth at optimal temperature. Core functions occurring at all temperatures are shown in the white box. Basic membrane lipoprotein and the major toga anchor protein refer to Kole_1554 and Kole_1500, respectively. See Fig. 2 for genes involved in pyruvate metabolism

