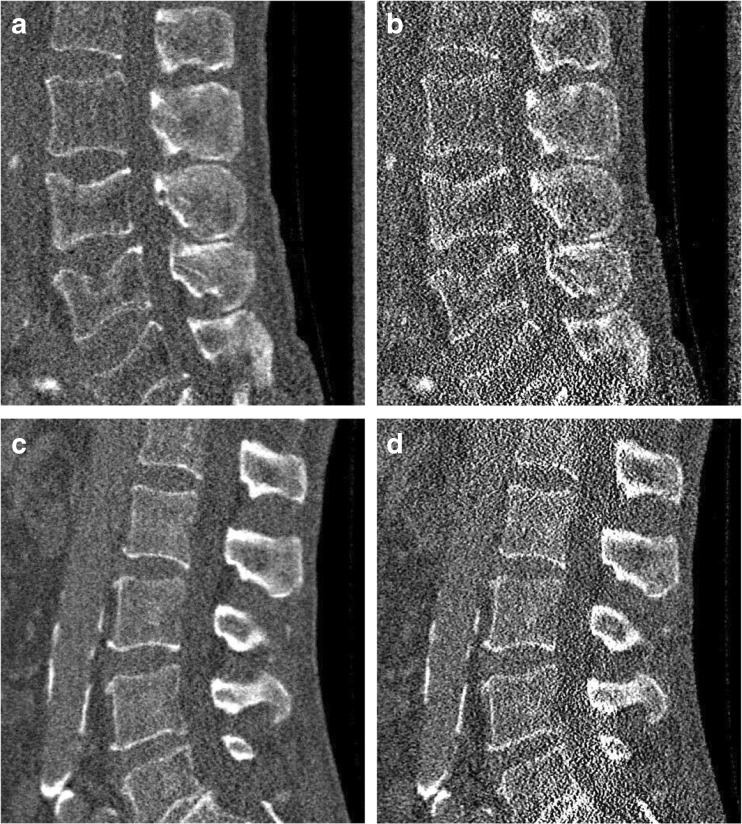
Fig. 4.
Representative sagittal reconstructions at 10% of the original dose level. The images depict the corresponding results for Fig. 1a and Fig. 1b. (a) and (c) represent the statistical iterative reconstruction (SIR) reconstructed image with 10% sparsely sampled projection. (b) and (d) show the SIR reconstructed images with the simulated 10% of the original tube current. Window level was 300 HU and width was 1,500 HU. Field of view was 180 × 153 mm2.

