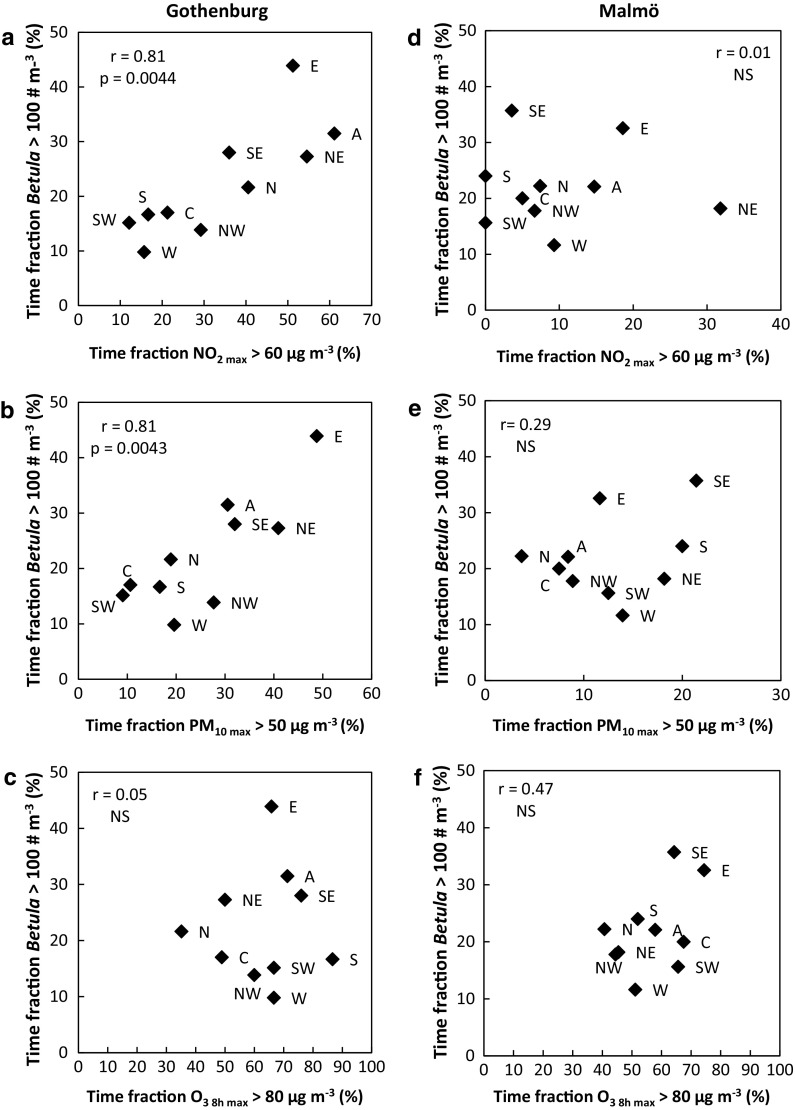
Fig. 4.
Relationships between time fractions of high daily atmospheric birch (Betula) pollen concentrations and exceedances of daily maxima of [NO2]max, [PM10]max and [O3]8h max in Gothenburg (a–c) and Malmö (d–f). The strength of the relationships was determined using Pearson product correlation coefficient (r) and significance level, using the F-test with p values referring to: *p < 0.05, **p < 0.01, ***p < 0.001, NS not significant

