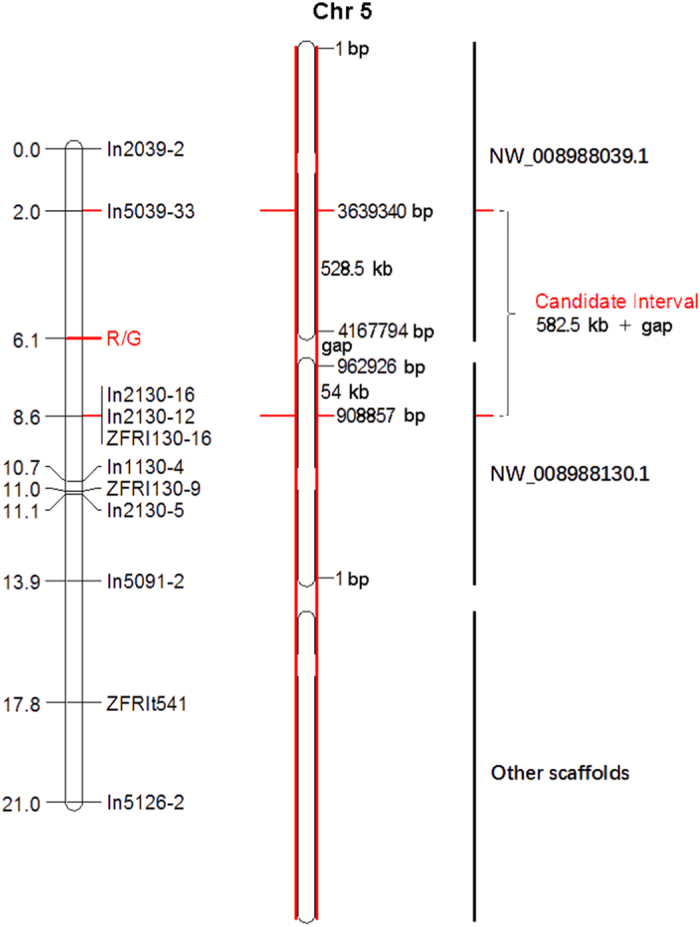
Figure 5.

Molecular markers and the red/green skin locus on LG5. The left one is the result of R/G locus linkage position, the middle one is the diagram of the chromosome, the black vertical bar on the right indicates the corresponding position of the scaffolds on the chromosome map, the red line on the right indicates R/G locus and the candidate interval.
